GA4 Event Fires in GTM but Never Arrives: How to Debug It
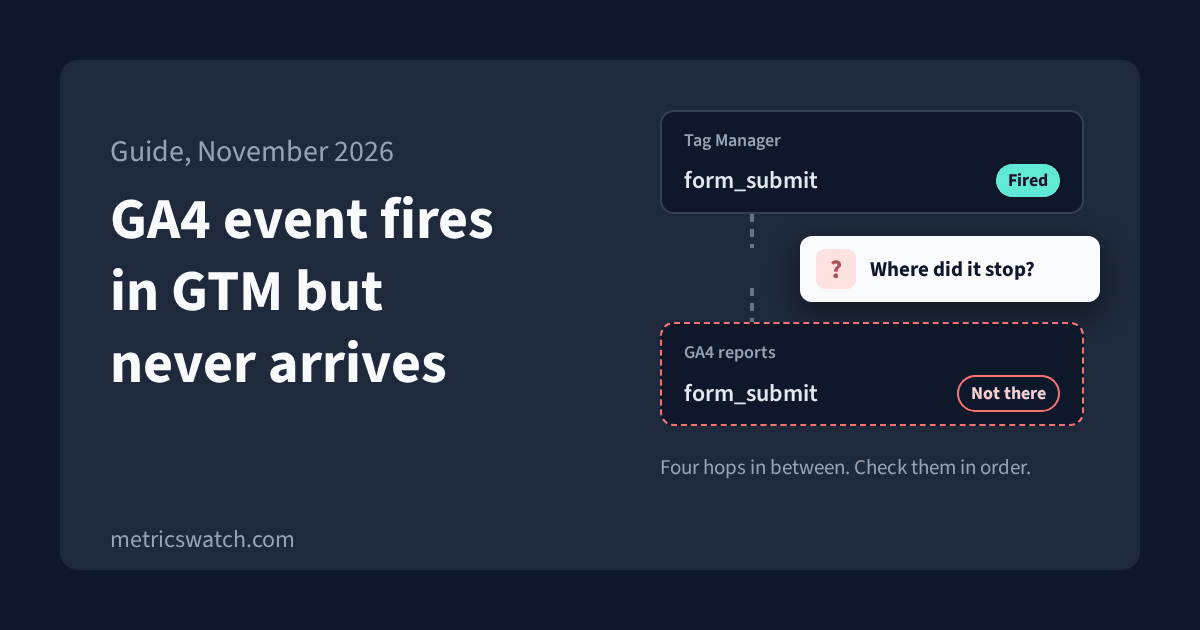
Your tag shows as fired in Tag Manager, and GA4 shows nothing. Or it shows every form submit twice. Or the bookings from that embedded widget just never turn up.
I see some version of this question in the analytics and PPC forums most days, and the answer is almost never that GA4 itself is broken. An event has to make four hops to get from a click to a report, and it can get stuck at any one of them. Once you know which hop it's stuck at, the list of things to check gets a lot shorter.
So that's how this guide is laid out: the four hops in order, then the opposite problem (events that arrive twice), then a checklist you can run through on any site. Wherever I describe how a Google tool behaves, I've linked to Google's own documentation. I checked every one of those pages on 9 November 2026.
The four hops, and the tool that sees each one
- The trigger fires. Tag Manager decides the tag should run.
- The browser sends a hit. A request actually leaves the page for Google.
- GA4 receives it. The event lands in the right property and isn't thrown away.
- It shows up in reports. Processing finishes and the event appears in your standard reports.
Each hop has its own tool, and the tool for one hop tells you nothing about the next. A green tick in Tag Manager means hop 1 worked. It doesn't mean hop 2 did.
It stops at hop 1: the triggerFind the event in Preview's left column. Is your tag under "Tags Not Fired"?
- The data layer event never comes. A theme or checkout-app update can rename or remove the push your trigger waits for.
- A condition or variable doesn't match. A variable that was empty when the trigger checked it is enough.
- Form trigger settings. Check "Check Validation" and "Wait for Tags" before anything else.
It stops at hop 2: nothing leaves the pageNetwork tab, filtered to google-analytics.com, then do the action again.
- Consent. With basic consent mode, tags are blocked until the visitor accepts. Test with consent accepted and declined.
- Blockers. An ad blocker, extension, consent tool, firewall or content security policy can stop the tag.
- An iframe. A booking widget or checkout on another domain needs the vendor to send a postMessage your page listens for.
It stops at hop 3: GA4 doesn't have itCheck the G- ID in the request URL against Admin, Data streams.
- Wrong measurement ID. A staging ID or an old property's ID sends healthy hits somewhere you aren't looking.
- A data filter excluded it. Internal and developer traffic filters are permanent: excluded data is never processed.
- DebugView isn't connected. Declined consent or privacy controls on your own browser can leave it empty.
It stops at hop 4: not in reports yetDebugView has it, so the hit arrived. Usually this is just time.
- Processing. Standard reports can take 24 to 48 hours, and numbers can change in that time.
- Realtime first. The Realtime report covers the last 30 minutes. Check it, then check standard reports tomorrow.
- A data filter. With an internal-traffic filter active, test events from the office never show up in reports.
Hop 1: Tag Manager Preview
In your workspace, click Preview, enter your site's URL and connect. Tag Assistant opens your site and shows you which tags fired, in what order, and what did or didn't trigger each one (Tag Manager Help, preview and debug containers).
Do the thing you're debugging, then find that event in the left column. If your tag is sitting under "Tags Not Fired", the problem is the trigger: the event name in the data layer, a condition, or a variable that was empty at the moment it got checked.
Hop 2: your browser's network tab
Open your browser's developer tools, go to the Network tab, filter for google-analytics.com, and do the action again. Google Analytics sends its data to *.google-analytics.com addresses (Google Tag Platform, content security policy guide).
If no request shows up when you act, the tag fired but nothing left the page. If one does show up, its URL includes the G- measurement ID it was sent to, so it's worth checking that ID while you're there.
Hop 3: DebugView
DebugView shows the events GA4 collects from a debug-enabled device in real time: the last 60 seconds in the middle column and the last 30 minutes on the left. Previewing through Tag Assistant turns debug mode on for your own device (Google Analytics Help, DebugView).
If the hit left your browser but the event isn't in DebugView, then either GA4 didn't receive it in this property or it isn't showing it to you. Both of those are in the hop 3 list further down.
Hop 4: reports
The Realtime report covers the last 30 minutes (Google Analytics Help, Realtime report). Standard reports are slower. Google says processing can take 24 to 48 hours, and the numbers can change during that time (Google Analytics Help, data freshness).
So an event that's in DebugView this afternoon but not in the Events report may just not be processed yet. I'd check again tomorrow before changing anything.
Ready to streamline your reporting?
MetricsWatch pulls twelve sources into one white-label report, delivered on your schedule: Google Analytics, Google Ads, Google Search Console, Google Business Profile, Google Sheets, Microsoft Advertising, Facebook Ads, Facebook Pages, Instagram, LinkedIn Ads, LinkedIn Pages, and Mailchimp. Starts at $49/month. 14-day free trial, no credit card required.
What breaks at each hop
The trigger fires on the wrong thing, or not at all
- Form submit triggers fire on attempts. Tag Manager's form submission trigger has a "Check Validation" option. If it's unticked, the trigger fires whenever someone tries to submit the form, including submits that fail validation. And without "Wait for Tags", a slow tag may not fire before the next page loads (Tag Manager Help, form submission trigger). I'd check both of these before touching anything else.
- The data layer event never comes. A custom event trigger only fires when the page pushes that exact event name. A theme update or a change to a checkout app can rename or remove that push, and the tag goes quiet even though nothing in Tag Manager changed.
The tag fires but no hit is sent
- Consent. With the basic consent mode setup, Google tags are blocked until the visitor consents, and while they're blocked no data is collected. With the advanced setup, tags load and send cookieless pings when consent is denied (Google Analytics Help, consent mode). If you're testing from a browser where you declined the banner, you're testing the blocked path. Accept it, or test in a fresh browser profile both ways.
- Blockers and extensions. These are on Google's own troubleshooting list: ad blockers and browser extensions can stop the Google tag from running, and so can a consent tool, a firewall or proxy, or a content security policy that doesn't allow Google's domains (Tag Assistant Help, troubleshooting). If you run an ad blocker, a missing hit on your own laptop proves less than it looks like it does.
- The event happens inside an iframe. This is the booking widget, scheduler and embedded checkout problem. Scripts on your page can only reach into another page if both share the same origin. The standard way for a widget on another domain to tell your page something happened is
postMessage(MDN, Window.postMessage()).
In practice that means your Tag Manager container can't see the click on "Confirm booking" inside someone else's frame. You need the vendor to send a message your page listens for, or to load your tag inside their frame through their own integration. One more catch: tags loaded inside an iframe can only be debugged in Tag Assistant if you have the Tag Assistant Chrome extension installed (Tag Assistant Help, troubleshooting).
The hit is sent but GA4 doesn't have it
- Wrong measurement ID. The G- ID connects your site to one web data stream, and it decides where the data goes. You'll find the right one under Admin, Data streams, in the first row of the stream details (Google Analytics Help, measurement ID). A staging ID copied into production, or an old property's ID, sends perfectly healthy hits somewhere you aren't looking.
- A data filter excluded it. Data filters can exclude developer traffic, internal traffic by IP, and hostnames, and the effect is permanent: excluded data is never processed and isn't available later in GA4 or BigQuery (Google Analytics Help, data filters). If you're testing from the office with an internal-traffic filter active, your test events will never show up in reports, however correct the tag is.
- A debug flag left on for everyone. Google says setting
debug_modetofalsedoesn't turn debug mode off; you have to remove the parameter (Google Analytics Help, DebugView). The developer traffic filter exists to exclude debug-mode activity (data filters). So if a debug flag got set on the Google tag for all visitors and that filter is active, it's excluding real visitors' events along with your test ones, and that can't be undone. - DebugView isn't connecting. DebugView doesn't show events when client-side privacy controls are in place, or when consent mode is on and you haven't consented to Analytics cookies (Google Analytics Help, DebugView). On a site with a consent banner, an empty DebugView can simply be your own declined consent.
When the event arrives twice
Double counting is the same diagnosis in reverse: find every place that sends the event.
form_submitenhanced measurement
form_submitTag Manager
form_submitgtag snippet
- Enhanced measurement plus a Tag Manager tag. With form interactions turned on, GA4's enhanced measurement sends
form_startandform_submiton its own, no code changes needed (Google Analytics Help, enhanced measurement events). If a Tag Manager tag also sends a form submit event, you get two events for one form. Pick one source and turn the other off. - A plugin and Tag Manager both sending purchases. A store app or CMS plugin that sends GA4 events, plus a Tag Manager purchase tag, is a classic way to end up with doubled revenue. In Preview, count how many requests leave the page for one test order.
- Purchases without a transaction ID. GA4 deduplicates purchase events that carry the same transaction ID, so a confirmation page that gets reloaded or revisited doesn't count twice. Don't send an empty string, though: GA4 deduplicates every purchase with
transaction_id=""into one, and reusing the same ID for different orders undercounts (Google Analytics Help, duplicate key events and transaction IDs). Only purchases get this protection. A doubled form submit doesn't. - Click versus success. A tag on the submit button click fires for every click, including double clicks and failed submits. A tag on the thank-you page, or on a success event in the data layer, fires once per real submission. If your click count and your success count are far apart, that gap is your duplicates and failures.
The checklist
- In Tag Manager Preview, do the action. Did the tag fire on the right event, once?
- In the Network tab, filtered to google-analytics.com: did exactly one request leave the page, to the right G- ID?
- Test with your ad blocker off and consent accepted, then again with consent declined, so you know what each kind of visitor sends.
- If the action happens in an iframe, check whose page it is. If it's another domain, ask the vendor how they report the event to the parent page.
- In DebugView, is the event there with the parameters you expect? If not, check the measurement ID and your data filters.
- Look for a second sender: enhanced measurement form events, a plugin, or a hard-coded gtag snippet sitting next to Tag Manager.
- For purchases, check that every event carries a unique, non-empty transaction ID.
- Search the live tag for
debug_modeand remove it if it's set for everyone. - Give processing time to finish before you judge the standard reports, then compare the count to your source of truth: orders in the store, submissions in the form tool.
If the event you're chasing is a purchase, our guide to setting up ecommerce tracking in Google Analytics covers the setup side.
Finding out the day it stops
Everything above helps once you've noticed something's wrong. The costly part is usually the stretch before anyone notices: a theme update renames a data layer event on a Tuesday, and the next person to see it is whoever opens the monthly report.
That gap is what MetricsWatch Alerts is for. It monitors GA4 traffic, conversions, events and custom metrics, and sends an email or Slack alert when one moves past a threshold you set, so a purchase or form_submit count that falls away shows up the same day. It checks every 15 minutes on Basic ($79/month, email alerts), every 10 minutes on Starter ($99/month, email and Slack alerts) and every 5 minutes on Professional ($299/month). You can filter an alert to a source, medium, campaign, landing page or other GA4 dimension.
To be clear about what it does and doesn't do: it reads what GA4 received. It'll tell you an event stopped arriving, and the four hops above are still how you find out why.
The trial doesn't need a credit card. If you want to try it, put an alert on your most important event at metricswatch.com/get-started.