A Practical Guide to Paid Search Analytics That's Actually Useful

Let's be real, the phrase 'paid search analytics' sounds like something cooked up in a lab by people who enjoy spreadsheets way too much. But what if it's just a fancy term for answering one simple question: "Is the money I'm spending on ads actually doing anything?"
Spoiler alert: it is. And this is your guide to turning a chaotic mess of numbers into your marketing superpower, no statistics degree required.
The Highlight Reel: Your Paid Search Analytics Cheat Sheet
Don't have time for the deep dive? You're busy, I get it. Here’s the TL;DR version to make you sound like a genius in your next meeting.
- Focus on the Money Metrics: Forget impressions. The only numbers that truly matter are Return On Ad Spend (ROAS), which tells you if you're making more than you're spending, and Cost Per Acquisition (CPA), which tells you how much it costs to land a customer.
- Garbage In, Garbage Out: Your analytics are only as good as your tracking. Messy tracking means your reports are just expensive fiction. Nailing conversion tracking in a tool like Google Analytics is non-negotiable.
- Automation is Your New Best Friend: Manually pulling reports is a soul-crushing time suck. Use dashboards to automate reporting so you can spend your time making smart decisions, not copy-pasting data. According to Statista, paid search accounts for about 33% of all online ad spending, so there's a lot of data to analyze—don't do it by hand.
- The Right Tool for the Job: Different tools solve different problems. Looker Studio is great for free, Google-centric analysis. MetricsWatch is perfect for automated reports for busy agencies. Tableau is the powerhouse for huge enterprise datasets.
Welcome to Paid Search Analytics Without the Headache

Running paid search ads without looking at the data is like driving with your eyes closed. Sure, you're moving, but who knows where you're going—or how much gas you’re burning to get nowhere.
That’s where paid search analytics comes in. It’s just the process of collecting and analyzing data from your pay-per-click (PPC) campaigns to make smarter, money-making decisions.
This isn’t about drowning in spreadsheets. It’s about confidently telling your boss what the ROI is. It’s the difference between guessing which ads work and knowing which ones are basically a money printer.
Why Paid Search Analytics Is a Game-Changer
Paid ads give you something most marketing channels can't: instant feedback. You can launch a campaign and see traffic in hours. In fact, research from Unbounce shows that paid search visitors convert 50% better than organic visitors. That’s a huge deal.
This direct line to revenue is exactly why analytics is so critical.
Effective paid search analytics helps you:
- Stop Wasting Money: Find the lazy keywords and ad groups that are eating your budget for lunch without delivering results.
- Double Down on Winners: Identify the high-converting campaigns that deserve more money and figure out how to clone their success.
- Understand Your Audience: Discover what messages and offers actually resonate with your customers—insights that can sharpen your entire marketing strategy.
Think of it this way: Your ad budget is the fuel, and your analytics are the GPS. Without the GPS, you’re just burning fuel and hoping you end up somewhere profitable. With it, you take the most direct route to your destination.
What to Expect From This Guide
We’re going to skip the dense jargon and focus on what actually works. This guide is your roadmap to understanding the metrics that drive growth, setting up your tracking correctly, and building reports that people actually want to read.
You’ll learn how to spot opportunities and fix problems before they become budget-draining disasters.
By the end, you'll see paid search analytics not as a chore, but as your secret weapon for outsmarting the competition. Let’s get to it.
Focusing on Metrics That Actually Matter
Your ad platforms throw a million different metrics at you. It can feel like you need a secret decoder ring just to figure out what’s going on. But here’s a secret: only a handful of them actually affect your bottom line.
This is your guide to separating the signal from the noise. We'll break down the paid search analytics that truly drive growth and help you ignore the ones that just look pretty.
From Vanity Metrics to Real Impact
Some metrics are the marketing equivalent of empty calories. They look good on a slide but offer zero real business value. These are what we call vanity metrics.
Impressions are the classic example. Seeing your ad was shown 100,000 times feels good, right? But if no one clicked it, or those clicks led to zero sales, then those impressions are just a big, expensive nothingburger.
The same goes for Click-Through Rate (CTR). A high CTR is great—it means your ad is catchy. But being popular doesn't pay the bills.
The real goal of paid search analytics is to connect every click and every dollar to a business outcome. If you can't trace a metric back to revenue, it's probably a distraction.
To get to the good stuff, you have to focus on the metrics that measure profitability and efficiency.
The KPIs That Actually Pay the Bills
Let's ditch the fluff and get straight to the numbers that your boss (and your bank account) care about. These are the Key Performance Indicators (KPIs) that are the foundation of good paid search analytics. You can learn more about how to track these essential Google Ads metrics in our detailed guide.
Here are the big three:
- Cost Per Acquisition (CPA): This is the ultimate "how much did it cost me?" metric. It tells you the average price you pay to get one new customer. If your CPA is lower than the value that customer brings in, you’re winning.
- Return On Ad Spend (ROAS): The king of all PPC metrics. ROAS answers the most important question: for every dollar I put in, how many dollars am I getting back? A 5:1 ROAS means you're making $5 for every $1 spent. It’s the clearest measure of profitability.
- Conversion Rate: This metric tells you what percentage of people who clicked your ad actually did the thing you wanted (like buy something). A high click rate but low conversion rate is a huge red flag that your landing page isn't working.
These metrics matter because they speak the language of business, not just marketing.
Understanding Attribution Models Without the Headache
So, a conversion happened. But which ad gets the credit? This is where attribution models come in, and honestly, they can be a pain. Let’s simplify it with a pizza analogy.
Imagine you and three friends order a pizza. One finds the place online, another calls to order, a third pays, and you pick it up. Who gets credit?
- Last-Click Attribution: This gives all the credit to the friend who paid. In marketing, it gives 100% credit to the very last ad a customer clicked. Simple, but it misses the bigger picture.
- First-Click Attribution: This gives all the credit to the friend who found the restaurant. It credits the first touchpoint, ignoring everything after.
- Data-Driven Attribution: This is the fairest way. It uses machine learning to look at all the touchpoints and assign partial credit based on how much each one contributed. It recognizes that every friend (and every ad) played a part.
Choosing the right model is crucial for accurate paid search analytics. It ensures you’re not accidentally pausing campaigns that are helping drive sales early in the game. And with data from Statcounter showing that over 60% of all searches now happen on mobile devices, understanding that multi-touch, multi-device journey is more important than ever.
Setting Up Your Analytics Toolkit for Success
Alright, let's get our hands dirty. Knowing which metrics to track is one thing, but if your setup is leaky, your data will be about as reliable as a weather forecast from a groundhog. Building a bulletproof tracking infrastructure is the "measure twice, cut once" part of your paid search analytics journey.
Think of it like plumbing. A single bad connection can throw the whole system off. We need to make sure every click, conversion, and dollar is accounted for.
The Holy Trinity of Paid Search Tracking
If you want clean, reliable data, you need to nail three core components. These aren't just suggestions; they're the non-negotiable foundation for any serious paid search effort.
Google Analytics 4 (GA4): This is your central nervous system for data. While ad platforms give you their version of the story, GA4 is your neutral source of truth. It shows you what users actually do after they click.
Consistent UTM Parameters: Think of these as little tracking barcodes on your ad URLs. They tell Google Analytics exactly which campaign, ad group, or keyword brought a visitor to your site. Without them, it's impossible to know what's working.
High-Converting Landing Pages: Sending expensive ad traffic to your generic homepage is a cardinal sin of PPC. A dedicated landing page is built for one thing: turning that click into a customer.
This simple flow chart shows how these pieces fit together.
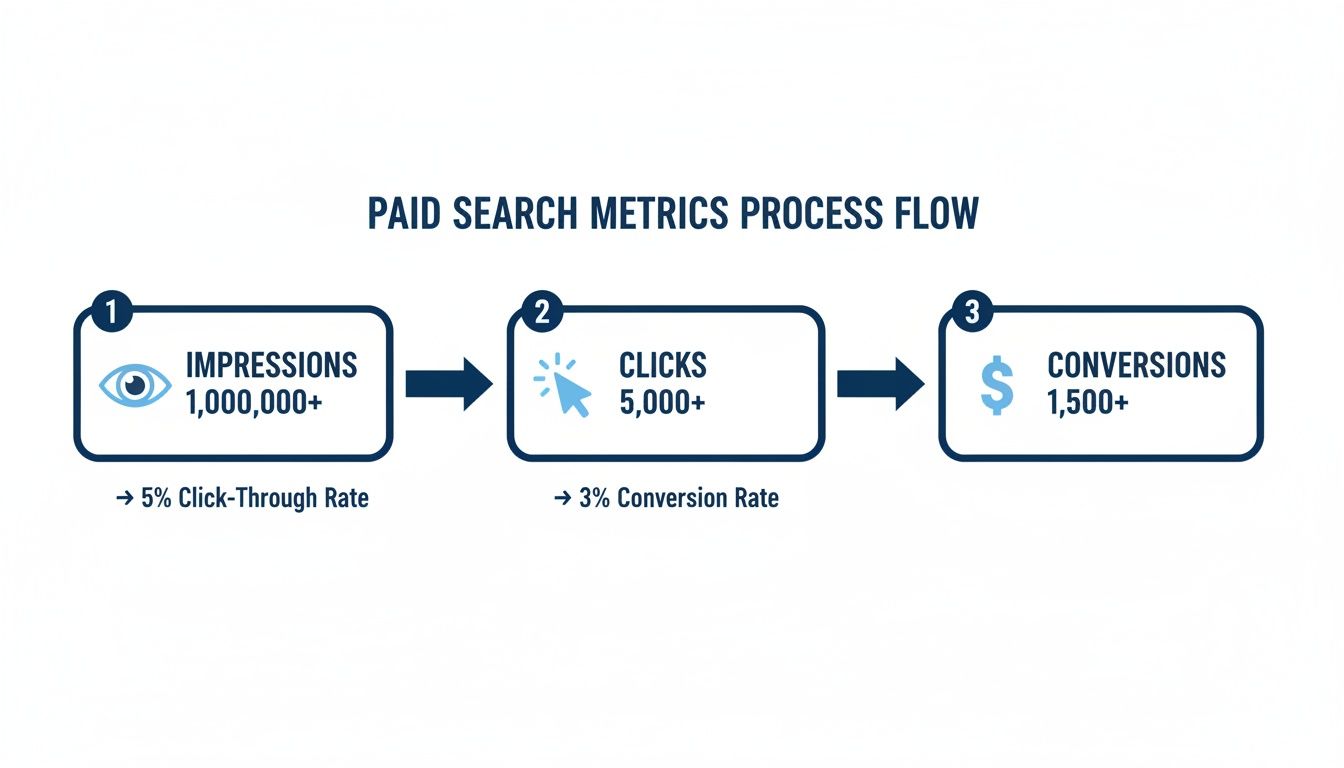
As the infographic shows, each step is a critical filter. The biggest wins are found by optimizing the handoff from impression to click, and then from click to conversion.
Creating UTMs That Tell a Clear Story
UTM parameters are your best friends for sorting through campaign data. A good UTM structure tells a story. Forgetting them is like sending a package with no return address.
A common mistake is being inconsistent. Analytics tools see
Here’s a simple breakdown of the essential UTM tags:
utm_source: Who sent the traffic? (e.g.,google,bing).utm_medium: What type of traffic is it? (always usecpcfor paid search).utm_campaign: Which specific campaign is this from? (e.g.,summer_sale_2024).utm_term: Which keyword triggered the ad?utm_content: What ad did they click on? (e.g.,blue_button_advs.red_button_ad).
Get this right, and you can finally prove that your "summer_sale" campaign on Google is outperforming everything else. To dive deeper into managing this, check out our guide on the best PPC reporting software to help automate the process.
Why Your Landing Page Is Your Secret Weapon
You can have the best ad copy, but if your landing page stinks, you're just burning money. Studies show that a dedicated landing page can increase conversion rates by 55% or more.
A dedicated landing page is laser-focused. It removes the navigation, footer, and any other links that could distract a user from the one action you want them to take. It should have a clear headline that matches the ad, compelling copy, and a single, obvious call-to-action button.
By creating a seamless journey from ad to landing page, you drastically increase your odds of turning that expensive click into a valuable conversion.
Building Dashboards That Tell a Compelling Story
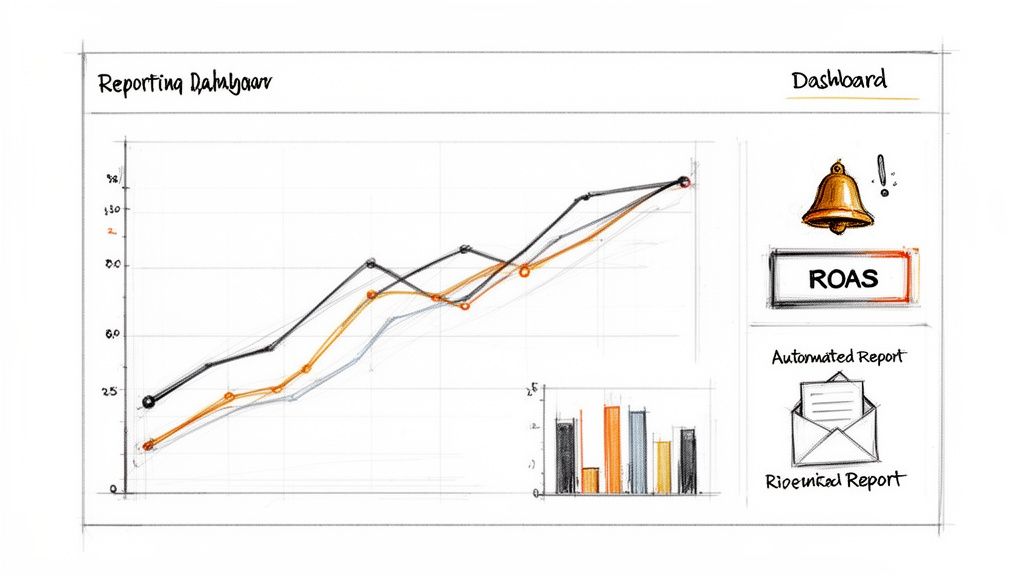
Nobody wants to stare at another spreadsheet. A great dashboard should tell a story, delivering those "aha!" moments at a glance. A bad one is just a digital graveyard where your data goes to die.
The goal is to create reports that people actually want to read—and can understand in about 30 seconds. It's all about visualizing your paid search analytics to shine a light on trends, not just listing boring metrics.
Choosing Your Reporting Weapon
First, you have to pick the right tool for the job. Manually copy-pasting screenshots into a slide deck is a soul-crushing waste of time. The right platform puts this on autopilot, so you can spend less time being a data mule and more time being a strategist.
Top Paid Search Analytics and Reporting Tools
| Tool | Best For | Key Feature | Pricing |
|---|---|---|---|
| Google Looker Studio | Startups & Freelancers on a budget who primarily use Google's ad ecosystem. | Deep, native integration with Google products (Ads, Analytics). It's powerful and completely free. | Free |
| MetricsWatch | Agencies & Busy In-House Teams who need to deliver reports without friction. | Fully automated email reports that send data directly to stakeholders' inboxes—no logins or PDFs required. | Starts at $49/mo |
| Tableau | Enterprise-Level Analysts with complex, massive data sets from multiple sources. | Extremely powerful business intelligence capabilities for blending and visualizing large-scale data sets. | Starts at $75/user/mo |
Your choice really comes down to your needs. Looker Studio is an unbeatable free option if you live in the Google ecosystem. For anyone who needs to get reports in front of clients and stakeholders with zero hassle, an automated solution like MetricsWatch is a lifesaver. You can dig deeper into different approaches to paid search dashboards to see what fits. And for complex, massive datasets, Tableau offers enterprise-grade power.
From Data Points to a Narrative
A good dashboard isn't just a collection of charts; it's a story. You aren't just presenting numbers—you're guiding your audience through a narrative that answers their biggest questions before they even ask.
The most effective dashboards answer three questions in this order:
- What happened? (The high-level summary)
- Why did it happen? (The trends and contributing factors)
- What should we do next? (The actionable recommendations)
This simple structure transforms a boring report into a strategic tool.
Essential Elements of a Killer Dashboard
To make your dashboard easy to scan, you need to focus on clean design. To make sure your dashboards are genuinely impactful, you should follow some key data visualization best practices.
Here are the must-have components:
- Executive Summary on Top: Lead with the most important KPIs: Total Spend, Conversions, CPA, and ROAS. This gives stakeholders the bottom line in seconds.
- Trend Lines Over Time: Use line charts to show performance over the last 30 or 90 days. This provides crucial context. Is that high CPA a one-day blip or a worrying trend?
- Performance Breakdowns: Use bar charts or tables to compare performance by campaign, ad group, or keyword. This helps you quickly spot your winners and losers.
- Clear Labels and Simple Language: Ditch the jargon. Instead of "CTR," write "Click-Through Rate." Add short text annotations to explain what a chart means, like, "Ad group B drove 75% of all leads this month."
Remember, the goal is clarity over complexity. If a chart is confusing, cut it.
Automating Your Reporting and Alerts
The real magic happens when you put your reporting on autopilot. The scale of paid search is massive. According to WordStream, the average small business using Google Ads spends between $9,000 and $10,000 per month. Trying to track all that by hand is a recipe for disaster.
This is where automated reporting and proactive monitoring become your best friends. Most modern dashboarding tools let you schedule reports to be sent out daily, weekly, or monthly.
Even better, you can set up alerts to warn you of sudden changes. Imagine getting a notification if:
- Conversions suddenly drop by more than 20% in a day.
- Your Cost Per Acquisition (CPA) spikes above your target.
- A top-performing campaign suddenly stops spending its budget.
This flips the script. You go from a reactive analyst who spots problems at the end of the week to a proactive strategist who can fix issues before they derail your budget.
Turning Your Insights Into Profitable Actions
So, you've got amazing dashboards. That's awesome. But data is completely useless unless you actually do something with it. It’s like having a map to buried treasure but never leaving your house to dig it up.
This is where all your hard work in paid search analytics starts to pay off. It’s time to stop just looking at numbers and start turning them into cash.
From Data Points to Action Plans
The best way to make your data useful is to create simple "if-then" scenarios. Think of these as your go-to playbook for common PPC problems.
Here are a few templates you can steal:
If you see a high Click-Through Rate (CTR) but a low Conversion Rate… This is the classic "great party, nobody buying" problem. Your ad is getting clicks, but your landing page is dropping the ball.
- Then check your message match. Does the headline on your landing page perfectly echo the promise in your ad?
- Then simplify your call-to-action. Is your CTA button obvious? Is the form too long? Make it ridiculously easy for them to convert.
- Then look at your page speed. Research from Google shows that as page load time goes from 1 to 3 seconds, the probability of a bounce increases by 32%. People have zero patience.
If your Cost Per Acquisition (CPA) is creeping up… This is a silent profit killer. It means it's getting more expensive to land each new customer.
- Then review your keyword performance. Are you paying a premium for broad, expensive keywords that don’t convert? Pause them and reallocate that budget.
- Then refine your audience targeting. Make sure you aren't showing ads to the wrong people. Use negative keywords to filter out irrelevant searches.
This whole process turns your paid search analytics from a history lesson into a forward-looking strategy. You’re not just reporting on what happened; you’re actively shaping what happens next.
Automating Your Defenses With Alerts
Let’s be real, you can't stare at your dashboards 24/7. That's where automated alerts come in, transforming you from a reactive data-puller into a proactive strategist. Think of them as a guard dog for your ad accounts.
You can set up systems to notify you the moment something goes sideways, like:
- A sudden, sharp drop in conversions.
- An unexpected spike in your CPA.
- A top campaign running out of budget before noon.
This is critical. With things changing so fast, anomaly detection is no longer a "nice-to-have." Beyond the basics, you can supercharge your analysis by utilizing Large Language Models (LLMs) for actionable insights. These tools can help you analyze data faster and generate recommendations.
When you combine automated monitoring with a clear set of action plans, you create a powerful system that not only spots problems but also gives you the exact steps to fix them.
Your Paid Search Analytics FAQs, Answered
Alright, let's get straight to it. Here are the no-fluff answers to the questions that really matter.
How Often Should I Be Checking My Paid Search Analytics?
For any live campaign, do a quick daily check-in. Just 5-10 minutes. This is about spotting disasters before they happen—like a keyword burning through your budget.
The real strategic work happens once a week. Block out 30-60 minutes to dig in. This is your time to spot trends, see what’s working, and make smart tweaks. This rhythm separates the pros from the people who just react to fires all day.
What's the Biggest Mistake People Make with PPC Data?
Hands down, getting obsessed with vanity metrics. Clicks and impressions feel good, but they don't pay the bills. A sky-high click-through rate means nothing if none of those clicks ever become a lead or a sale.
The one rule you can't forget in paid search analytics is to connect every piece of data back to a real business outcome. Your world should revolve around metrics that speak the language of profit, like Return On Ad Spend (ROAS) and Cost Per Acquisition (CPA).
How Can I Actually Prove My Campaigns Are Working to My Boss?
You've got to speak their language: results and revenue. Forget the marketing jargon.
Present the numbers that hit the bottom line:
- "This month, we put in $1,000 and got $5,000 in new sales back. That’s a 5x ROAS."
- "We brought in 50 new customers, and it only cost us $20 each, which is way under our $30 target CPA."
Use simple dashboards with big, clear numbers to show this off. When you can draw a straight line from your ad spend to the money coming in, proving your value is easy.
Tired of digging through data just to find the important stuff? MetricsWatch sends you clear, automated reports with the insights you actually need, delivered right to your inbox. Stop guessing and start knowing what's happening with your campaigns.
Start your free trial with MetricsWatch today and see exactly what you've been missing.


