Understanding KPI vs Metrics: Which Matters for Your Business?

Let's be honest, the terms "KPI" and "metric" get thrown around in meetings so often they’ve pretty much become corporate buzzwords. It's time to set the record straight, before we all start twitching every time someone says "synergy."
Here's the simple truth: A KPI is a metric, but not all metrics are KPIs.
Confusing them is like mistaking your car's top speed for the amount of gas in the tank. Both are useful numbers, but only one tells you if you'll actually make it to your destination before you have to start pushing.
What Is The Real Difference Between KPIs And Metrics
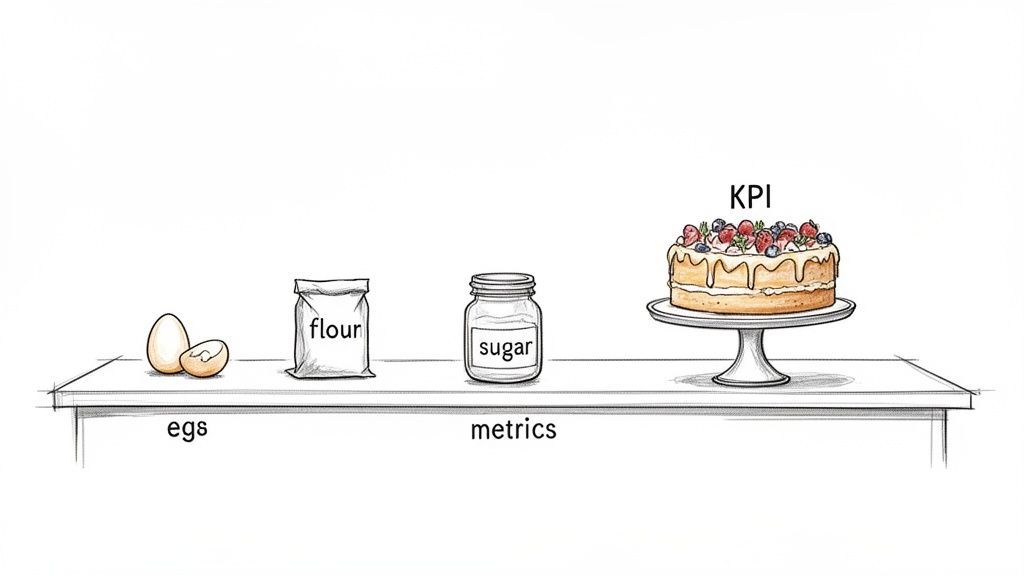
Alright, let's cut through the jargon for good. Imagine you're trying to bake an award-winning cake. You've got all your ingredients laid out on the counter: flour, sugar, eggs, butter, maybe even some fancy sprinkles.
Those individual ingredients? Those are your metrics. They are simple, quantifiable data points. You can measure the cups of flour, the number of eggs, and the temperature of the oven. These are all important pieces of information that track what you're doing.
The final, delicious, prize-winning cake? That’s your Key Performance Indicator (KPI).
The KPI is the ultimate outcome you actually care about—the thing that directly proves you’ve achieved your main goal. You don't win a baking competition by having the most flour; you win by baking the best cake. A KPI is a carefully selected metric that is absolutely critical to your success.
This whole "ingredients vs. cake" analogy isn't just a fun way to think about it; it gets to the heart of their strategic value. One measures activity, while the other measures impact. It's a common mix-up, and getting it wrong can lead to some serious tracking headaches and wasted effort.
Key Takeaway: Metrics are the raw data points that measure business activities. KPIs are the specific, strategic metrics you've chosen to measure progress toward a critical business objective.
A Quick Look At KPIs vs Metrics
This table provides a simple, side-by-side comparison to quickly highlight the core differences between Key Performance Indicators and metrics, focusing on their purpose, scope, and strategic impact.
| Characteristic | Metrics (The Ingredients) | KPIs (The Final Dish) |
|---|---|---|
| Purpose | To track day-to-day business processes and activities. | To measure progress toward critical business objectives. |
| Focus | Tactical and operational. They tell you what happened. | Strategic. They tell you if you are succeeding. |
| Quantity | Many. You can track hundreds of different metrics. | Few. You should only have a handful of crucial KPIs. |
| Example | Website visitors, email open rate, social media likes. | Customer Lifetime Value (CLV), Conversion Rate, Monthly Recurring Revenue (MRR). |
Getting this hierarchy right is the first step toward making sharp, data-driven decisions instead of getting lost in a sea of numbers that don't actually move the needle. You absolutely need metrics to understand the "why," but you need KPIs to know if you're winning.
Metrics: The Humble Building Blocks Of Your Business
Let's think of metrics as the diligent, slightly obsessive data collectors for your business. They're constantly in the background measuring just about everything: website visitors, email open rates, social media likes, and maybe even how many times the office coffee pot was refilled today. They are the humble, hardworking foundation of all your business intelligence.
Put simply, metrics are any quantifiable measure used to track and assess a specific business process. They’re the raw numbers, the day-to-day data points that show you what’s happening on the ground.
While not every metric is going to make it into the boardroom spotlight, they provide the critical context needed to diagnose problems and spot opportunities. These are the numbers that track routine activities, and they're the key to figuring out why your bigger goals are—or aren't—being met.
The Good, The Bad, And The Vain
It's true: not all metrics are created equal. Some are incredibly useful for making decisions, while others are really just there to make you feel good. Knowing the difference is crucial to avoiding wasted effort.
- Actionable Metrics: These are the gold standard. They tie specific, repeatable actions directly to observable results. For instance, the conversion rate of a landing page is actionable because you can change the headline (an action) and immediately see if the rate improves (a result).
- Vanity Metrics: These are the numbers that look great on the surface but don't actually tell you anything meaningful about your business's health. Think total social media followers or website hits. Sure, they're nice to look at, but they don’t automatically translate to revenue or customer satisfaction.
The real danger here is mistaking vanity metrics for actual performance indicators. Chasing more "likes" can feel productive, but it often pulls focus from the metrics that genuinely drive growth.
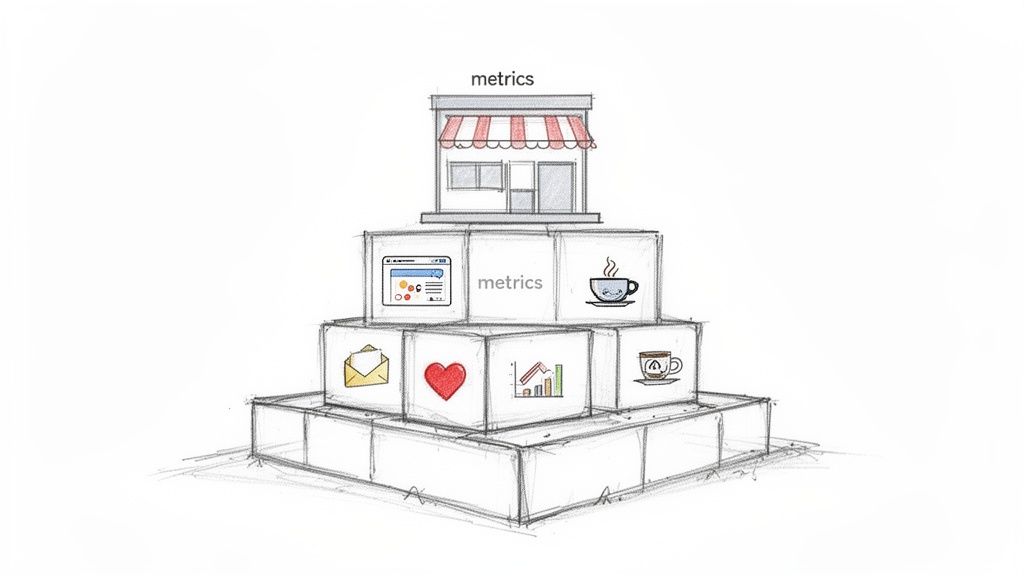
Why You Need A Mountain Of Metrics
It might sound a little counterintuitive, but having a wide array of metrics is actually essential. While you should only focus on a handful of key indicators at a strategic level, that supporting cast of metrics is what gives you the full story.
Imagine your "Customer Satisfaction Score" (a potential KPI) suddenly takes a nosedive. How do you figure out why? You'd need to dig into your operational metrics to get answers:
- Average Support Ticket Response Time: Has this number crept up recently?
- First-Contact Resolution Rate: Are you solving customer problems on the first try?
- Number of Negative Product Reviews: Is a specific new feature causing widespread frustration?
Without these more granular metrics, your KPI is just a flashing red light without any explanation. They provide the diagnostic data you need to truly understand performance. To see how this plays out in different fields, you can check out examples of how to measure things like software quality metrics.
A Bain & Company study found that companies with strong data analytics capabilities were twice as likely to be in the top quartile of financial performance within their industries. This high-level performance is always built on a solid foundation of tracking the right metrics.
At the end of the day, metrics are the individual data points that, when you combine and analyze them correctly, tell the story of your business. While many of them will never be a "key" indicator, they are the indispensable building blocks for every single strategic decision you make. You can learn more about finding the right ones by reading our guide on what a metric is in Google Analytics.
KPIs: The A-Listers Of Your Business Strategy
If metrics are the hardworking supporting cast, then Key Performance Indicators (KPIs) are the A-list superstars of your business. They get top billing for a reason. A KPI isn’t just some random number you decided to track; it’s a carefully chosen, high-impact measure that’s absolutely critical to hitting a major business objective.
Think of it like this: your car's dashboard is flooded with metrics—engine RPM, oil pressure, tire pressure, you name it. But the only two you really glance at constantly are your speed and your fuel level. Those are your KPIs for the trip. They tell you if you'll actually get to your destination on time and without running out of gas.
KPIs are the vital few that tell you if you're winning the game, not just how many times you passed the ball.
Making Your KPIs SMART, Not Just Clever
The business world loves its acronyms, and when it comes to setting goals, SMART is the one that actually works. It’s a simple gut check to stop you from chasing vague, useless targets and instead focus on what will drive real results.
A great KPI isn’t just a wish; it’s a battle plan.
Let’s break this down in a way that’s practical, not just a bunch of corporate buzzwords:
- Specific: Your goal needs to be crystal clear. "Improve sales" is fuzzy and unhelpful. "Increase online sales revenue for our new sneaker line" is specific.
- Measurable: You have to be able to track it with a number. If you can't measure it, you can't manage it. "Increase sales by 15%" is measurable.
- Achievable: You want to be ambitious, not delusional. A good goal should stretch your team, not break their spirit. A 15% increase might be a tough but possible challenge; a 500% increase is probably just a fantasy.
- Relevant: Does this KPI actually matter to the big picture? Increasing website traffic is nice, but if your main business goal is profitability, a KPI like "Improve Customer Lifetime Value (CLV)" is way more relevant.
- Time-bound: Every goal needs a deadline. "Increase CLV by 15% in Q4" creates urgency and a clear finish line for everyone.
When you put it all together, a weak goal like "Get more customers" transforms into a powerful KPI: "Increase new customer acquisition by 20% by the end of the second quarter." See the difference? One is a hope, the other is a target.
A great KPI is a statement of intent. It connects a specific metric directly to a strategic business outcome, providing a clear measure of success that everyone on the team can understand and rally behind.
The Strategic Power of a Good KPI
The idea of KPIs isn't new, but the way modern businesses use them has become a total game-changer. The concept really took off in the 1990s, thanks to Peter Drucker’s work on management by objectives, and its use has skyrocketed ever since.
For instance, one study found that companies that consistently align their projects with their KPIs are 62% more likely to achieve their goals. If you want to dig deeper into these trends, you can explore more findings on KPI effectiveness.
This really gets to the heart of the KPIs vs metrics debate. While metrics track processes, KPIs drive strategy forward. When you promote a metric to KPI status, you're sending a clear message across the entire company: "This is what matters most right now."
It aligns teams, focuses resources, and turns abstract business goals into tangible, trackable targets that lead to real, measurable growth.
How KPIs And Metrics Work Together To Tell The Full Story
A KPI without supporting metrics is like a smoke alarm with dead batteries. It looks the part, but when a fire actually breaks out, it's useless. It might tell you something is wrong, but it can't point you to the source of the blaze. The real magic happens when KPIs and metrics team up to tell the full, actionable story.
Think of it like a doctor diagnosing a patient. The KPI is the big, obvious symptom: "The patient has a fever." That's critical information, for sure, but it’s not enough to write a prescription. Is it the flu? An infection? Or did they just run a marathon in a wool sweater?
To get to the why, the doctor has to dig into the metrics: blood pressure, white blood cell count, heart rate. Each metric is a piece of the puzzle. It’s the exact same relationship in business; KPIs sound the alarm, and metrics are what you use to investigate the cause.
The E-commerce Churn Rate Mystery
Let's walk through a real-world scenario. Imagine you run an e-commerce store, and your leadership team sets a big, hairy, audacious KPI for the quarter: "Decrease customer churn by 10%." This is a solid KPI. It's specific, measurable, time-bound, and directly impacts the bottom line.
For the first month, everything looks great. But in week five, your KPI dashboard starts flashing red. Not only is your churn rate not decreasing, but it’s actually starting to creep up. The smoke alarm is blaring. Now what?
This is where your metrics team (or you, wearing your detective hat) gets to work. You can't just "fix churn"—it's too vague. You have to investigate the underlying metrics that are pushing it in the wrong direction.
You start asking questions and pulling the data to answer them:
- Is our customer support dropping the ball? Check the
Average Support Ticket Response TimeandFirst-Contact Resolution Rate. If response times have suddenly doubled, you've probably found a culprit. - Are customers unhappy with the product? Look at the
Product Return Rateand theAverage Customer Satisfaction (CSAT) Score. A spike in returns for one specific item could be the smoking gun. - Is our website frustrating people? Dive into the
Cart Abandonment RateandWebsite Loading Speed. Maybe a recent update introduced a bug that's breaking the checkout process.
This whole process perfectly illustrates the hierarchy of goals, KPIs, and metrics.
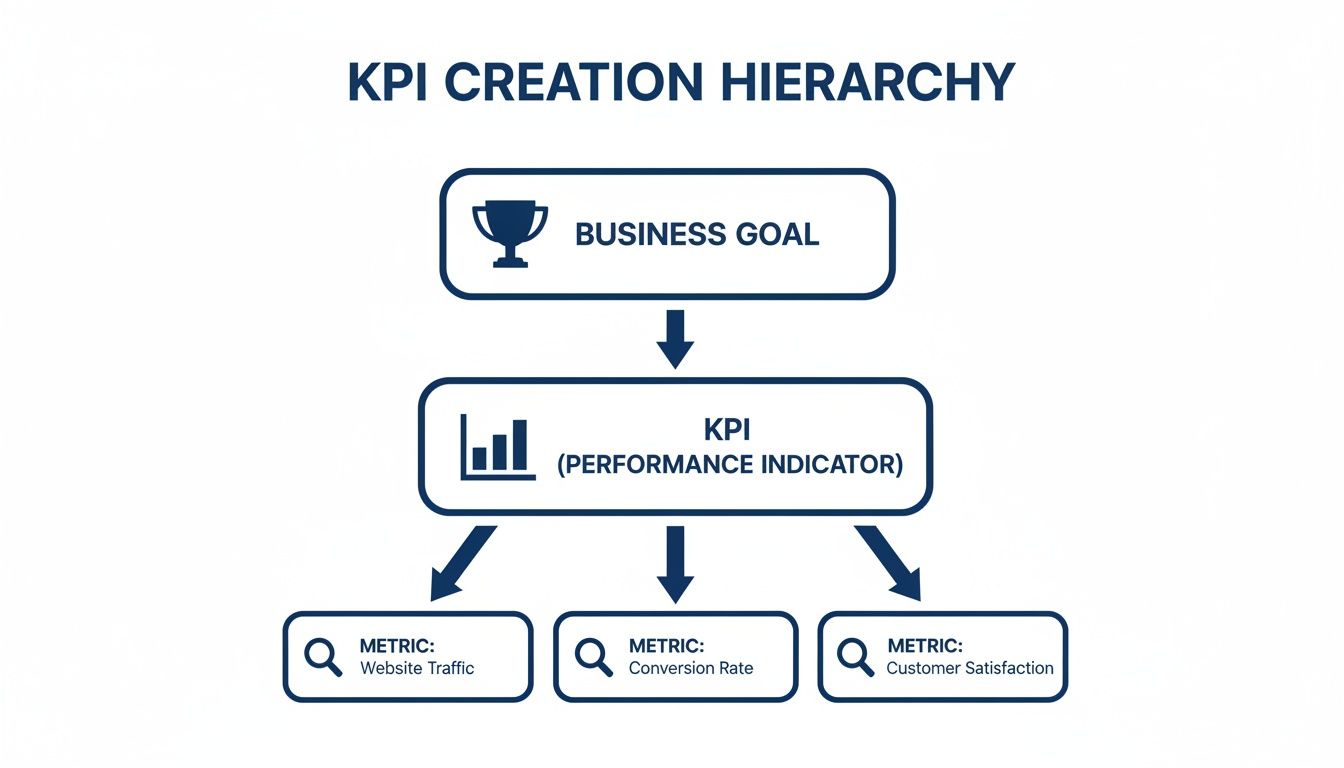
As the diagram shows, a broad business goal gets focused into a specific KPI, which is then propped up by several granular metrics. The metrics are the foundation, giving you the raw data you need to actually influence the KPI and hit your main business objective.
By digging into these metrics, you quickly find that the Average Support Ticket Response Time has shot up by 40% in the last two weeks. Boom. You've gone from a high-level problem ("churn is up") to a specific, solvable issue ("our support team is swamped"). Your metrics have shown you exactly where the fire is.
Key Insight: Metrics give you the story behind your KPI's performance. They turn a single, scary number into an actionable narrative with characters (your customers), a plot (their frustrating experience), and a clear resolution (fixing the support bottleneck).
This relationship is everything. Without metrics, a failing KPI just creates panic. With them, it becomes a diagnostic tool that points you right to the part of the business that needs your attention. They work together, turning abstract goals into concrete actions.
Example KPIs And Their Supporting Metrics
To make this even more concrete, here are a few common business goals, the KPIs you'd use to track them, and the supporting metrics that provide the "why."
| Business Goal | Key Performance Indicator (KPI) | Supporting Metrics to Watch |
|---|---|---|
| Increase Brand Awareness | Social Media Engagement Rate | Likes, comments, shares, mentions, follower growth rate, reach, impressions. |
| Improve Customer Loyalty | Customer Lifetime Value (CLV) | Repeat purchase rate, average order value (AOV), purchase frequency, customer churn rate. |
| Boost Website Lead Generation | Conversion Rate (Form Submissions) | Website traffic, bounce rate, time on page, pages per session, click-through rate (CTR) on CTAs. |
| Enhance Product-Market Fit | Net Promoter Score (NPS) | Customer satisfaction (CSAT) score, feature usage rate, product return rate, user onboarding completion rate. |
| Optimize Marketing Spend | Customer Acquisition Cost (CAC) | Cost per click (CPC), cost per lead (CPL), campaign spend, ad impressions, lead-to-customer conversion rate. |
As you can see, each KPI is a summary of a bigger story, and the supporting metrics are the individual chapters. By monitoring both, you get a complete picture of your performance and know exactly which levers to pull to drive improvement.
How To Choose The Right KPIs For Your Business
Alright, you get it. KPIs are essential. But how do you actually pick the right ones without getting lost in a sea of blinking, useless numbers? It's a classic case of analysis paralysis, and it's easy to build a dashboard that looks more like a space shuttle cockpit than a simple roadmap.
The secret isn’t to stare at all the metrics you could track. Instead, work backward from your big-picture business objectives. What are the one or two things that absolutely have to go right for your company to win this year?
Start With Your "Why"
Before you even glance at a spreadsheet, you need to ask some hard strategic questions. Think of your goals as the destination and your KPIs as the GPS that gets you there.
- What is our primary business goal for this quarter? (e.g., Increase profitability)
- What outcome defines success? (e.g., Growing our customer base in a new market)
- Who is responsible for this outcome? (e.g., The marketing and sales teams)
Once you have a crystal-clear objective, you can start identifying the key results that prove you've achieved it. This simple shift—from "what can we measure?" to "what must we achieve?"—is what separates a cluttered dashboard from a focused, winning strategy.
Less Is More. Seriously.
The "K" in KPI stands for "Key." Not "Kinda Important" or "Keep an eye on it just in case." You can’t have 20 "key" priorities. That’s just a wish list.
Most successful businesses limit themselves to just 5-7 KPIs for their main annual goals. This laser focus isn't about being lazy; it's about forcing yourself to choose what truly moves the needle. The temptation to track every little thing is real, but it’s a trap that leads to wasted time and effort.
According to Geckoboard's 2021 survey, 74% of employees feel overwhelmed when they have too many KPIs. This isn't just about saving a few hours; it's about keeping your team sane and focused.
This is about aligning your entire team. When everyone knows the handful of numbers that define success, they can make smarter, faster decisions without getting bogged down in secondary data. For more specific examples, you can check out our guide on how to choose KPIs for marketing dashboards.
A Practical Framework For Choosing KPIs
Ready to build your KPI A-team? This simple, three-step process will help you filter out the noise and zero in on the indicators that will actually drive your business forward.
Link Directly to a Business Goal: If you can't draw a straight line from the KPI to a core business objective, ditch it. For instance, if your goal is to improve customer loyalty, "website traffic" is a poor KPI. A much better choice would be Customer Lifetime Value (CLV).
Ensure It's Actionable: A good KPI has to inspire action. When the number goes up or down, your team should know exactly what to do. The metric "Number of Support Tickets" isn’t nearly as actionable as "First-Contact Resolution Rate," which tells your team to focus on solving problems more efficiently on the first try.
Choose Leading Indicators: While lagging indicators (like last month's revenue) are important for reporting, the best KPIs often predict future success. For example, a leading indicator like "Number of Qualified Sales Demos Booked" is a fantastic predictor of future revenue. It tells you where you're headed, not just where you've been.
As you build out your list, it's also crucial to measure customer service with KPIs that matter to ensure you're hitting your desired outcomes. By focusing on purposeful, actionable, and forward-looking indicators, you’ll build a dashboard that isn't just a data dump—it's a genuine roadmap to success.
Let's Get Real About Monitoring KPIs and Metrics
Look, nobody has time to manually check dozens of metrics every single day. That’s a one-way ticket to burnout. It's like trying to watch every blade of grass grow on your lawn—you’ll go cross-eyed long before you spot any real patterns, and you’ll probably miss the giant weed slowly taking over the back corner.
This is where the whole KPI vs. metric discussion gets practical. All this data is completely useless if you can't keep an eye on it without losing your mind. Luckily, we don't have to do it by hand anymore.
Why Manual Reporting Is a Terrible Idea
Pulling data manually isn't just a drag; it's surprisingly risky. Did you know that studies have shown 88% of all spreadsheets contain errors? These are usually simple human mistakes—a typo here, a copy-paste fail there. One misplaced decimal, and your "stellar" campaign performance suddenly looks like a total disaster.
And then there's the time suck. Just imagine spending the first hour of every day logging into Google Analytics, your ad platforms, and your CRM, just to copy numbers into a report that’s basically obsolete by lunchtime. That's precious time you could be spending on actual strategy, not mind-numbing data entry.
The goal isn’t just to have data; it's to get timely, accurate insights without getting buried in the process. Automation is the bridge from data chaos to clear, actionable intelligence.
Let the Robots Do the Heavy Lifting
This is where modern tools come in to save your sanity. Platforms like MetricsWatch were built to solve this exact problem. They plug directly into your data sources—like Google Analytics, Google Ads, and others—and do all the boring work for you.
Here’s how automation completely changes the game:
- Scheduled Reports: Instead of you chasing down the data, the data comes directly to you. You can set up clean, easy-to-read reports to land in your inbox daily, weekly, or monthly. This keeps your KPIs front and center without the manual grind.
- Consolidated Data: Forget about juggling five different browser tabs. Automation tools pull your most important numbers from various platforms into a single, unified view. You get the full story, all in one place.
- Immediate Alerts: Now this is where things get really cool. What if you could know the instant something goes wrong (or unexpectedly right)? Automated alerts act like a watchdog for your data.
For example, you could get an alert via email or Slack the moment your e-commerce conversion rate suddenly tanks, or if a critical landing page starts throwing a spike in 404 errors. This kind of proactive monitoring lets you fix problems in minutes, not days. If you manage multiple clients or campaigns, you can learn more about streamlining this process with our guide on automated marketing reports.
By automating both your KPI reporting and your underlying metric monitoring, you free up your team to focus on what actually matters: analyzing the insights and making smart decisions that drive growth. You get all the benefits of being data-driven without any of the soul-crushing admin work.
A Few Lingering Questions About KPIs vs Metrics
Still have a few questions buzzing around your head? You’re not alone. The whole KPI vs metrics thing can feel a little abstract at first.
Let's tackle some of the most common head-scratchers I hear. We’ll clear up the last bits of confusion so you can walk into your next meeting with total confidence.
Can A Metric Ever Become A KPI?
Absolutely. Think of it as a well-deserved promotion. A metric gets the call-up to KPI status the moment it becomes directly tied to a critical business objective. It's all about context.
For instance, "website traffic" is usually just a metric. It’s a number. But if your company's main goal for the quarter is to dominate a new market and jack up brand awareness, then "monthly unique visitors" could absolutely become a KPI for your marketing team. The role of a number depends entirely on its strategic importance right now.
How Many KPIs Should A Team Actually Track?
Less is more. Seriously. While there’s no magic number that fits everyone, most experts I talk to suggest a department should focus on just 5-7 core KPIs.
It's simple logic, really.
If you have 20 "Key" Performance Indicators, then guess what? None of them are truly key. You just have a long to-do list.
Focusing on a smaller, more manageable set ensures your team stays aligned and doesn't get sucked into "analysis paralysis." Each KPI should carry enough weight that if it starts trending in the wrong direction, it’s treated as an all-hands-on-deck emergency. It’s about sharp focus, not a shotgun blast of data.
What Is The Biggest Mistake People Make With KPIs?
The most common mistake, by a country mile, is tracking "vanity metrics" and calling them KPIs. These are the numbers that feel good to look at but don't actually tell you a thing about the health of your business. Think total social media followers or the number of app downloads you have.
A true KPI is always tied to a meaningful business outcome—things like revenue, customer retention, or operational efficiency. A Bain & Company study found that companies with strong data capabilities were twice as likely to be top financial performers. That kind of performance comes from tracking outcomes, not just outputs. Celebrating vanity metrics is like celebrating how fast your engine is spinning instead of checking how far you've traveled.
How Can I Get My Team To Actually Care About Our KPIs?
This is the million-dollar question, isn't it? The answer has two parts: make them relevant and make them visible. First, you have to connect each person's daily work directly to a KPI.
- When a support agent sees how their
average resolution timemetric impacts the company's overallcustomer satisfactionKPI, their work suddenly has a much clearer purpose. - Similarly, when a content writer sees how their blog post's
conversion ratecontributes to thecustomer acquisition costKPI, they understand their role in the bigger picture.
Second, you have to make the data impossible to ignore. Use dashboards and automated reports to keep the numbers front and center. When people can see the score in real-time, they're a whole lot more motivated to help win the game.
Stop wasting time on manual reporting and start getting the insights you need, when you need them. MetricsWatch automates your reports and alerts, pulling data from all your marketing platforms into one clear view. Get a free trial of MetricsWatch today and see how easy it is to stay on top of your data.


