10 Data Driven Decision Making Examples to Steal Today

Ever feel like your business strategy is just a series of educated (and sometimes not-so-educated) guesses? You're not alone. In a world practically drowning in data, it’s shockingly easy to ignore it all and just go with your gut. But here's the thing: your gut doesn't know why your conversion rate just tanked last Tuesday.
Data-driven organizations aren't just a little better off; they're basically playing a different sport. According to Forrester, they are 178% more likely to smash their revenue goals compared to their peers. That’s not a small difference; that’s the gap between thriving and barely surviving. Gut feelings are great for picking a lunch spot, but for optimizing your marketing budget, you need something a bit more… scientific.
This guide isn't about boring theory or abstract concepts. We're diving headfirst into 10 practical and totally stealable data driven decision making examples you can start using today. We’ll break down the exact steps for everything from campaign optimization and customer segmentation to product development and stopping customers from ghosting you.
You'll see the specific business questions, the key metrics to track, and the steps to take to turn raw information into your most powerful competitive advantage. We’ll also show how a tool like MetricsWatch can automate the monitoring and reporting, so you can stop guessing and start growing with confidence. Let's get to it.
1. Real-Time Website Performance Monitoring and Anomaly Detection
Waiting a week to find out your checkout button was broken is a special kind of marketing nightmare. This is where real-time monitoring comes in, a prime example of data-driven decision making that shifts teams from reactive problem-solving to proactive firefighting. Instead of discovering a catastrophic drop in conversions during a monthly report, teams get alerted the moment things go sideways.
This approach involves setting up automated systems to watch key website metrics 24/7. When a metric suddenly deviates from its expected pattern—like a sudden nosedive in organic traffic or a spike in 404 errors—an alert is triggered. This allows teams to investigate and fix problems like broken tracking codes, server outages, or faulty GA4 implementations within minutes, not days, saving potentially thousands in lost revenue.
Strategic Breakdown
- Business Question: "How can we immediately detect and respond to critical website issues that impact revenue and user experience before they cause significant damage?"
- Key Metrics & Data Sources:
- Conversion Rate: (e.g., E-commerce checkout completions, lead form submissions) from Google Analytics 4.
- Traffic Volume: (Overall sessions, users by channel) from GA4.
- Technical Performance: (Page load speed, server error rate) from Google Search Console or tools like Datadog.
- Engagement: (Bounce rate, session duration) from GA4.
- Expected Outcome: A massive reduction in the time it takes to identify and resolve critical site issues, leading to minimized revenue loss, improved data integrity, and a more stable user experience.
Key Insight: The goal isn't just to collect data; it's to shorten the "time-to-insight" to near zero for your most critical metrics. A 10% conversion drop that lasts for five minutes is a minor hiccup; one that lasts for five days is a disaster.
How MetricsWatch Accelerates This Process
MetricsWatch is built for this exact scenario. Instead of you having to manually check your analytics dashboards, it acts as your automated watchdog. You can configure it to:
- Set Anomaly Alerts: Automatically get notified via email or Slack if your checkout conversion rate drops by more than 15% compared to the previous day's average.
- Monitor Client Accounts: Agencies can set up custom alerts for each client, ensuring a broken tracking pixel on one site doesn’t go unnoticed.
- Consolidate Reporting: Combine alerts with automated marketing reports to provide a full performance picture.
This hands-off monitoring transforms your team's workflow, freeing them from constant manual checks and allowing them to focus on strategic initiatives. If you're looking to implement this, our guide on real-time website monitoring provides a great starting point.
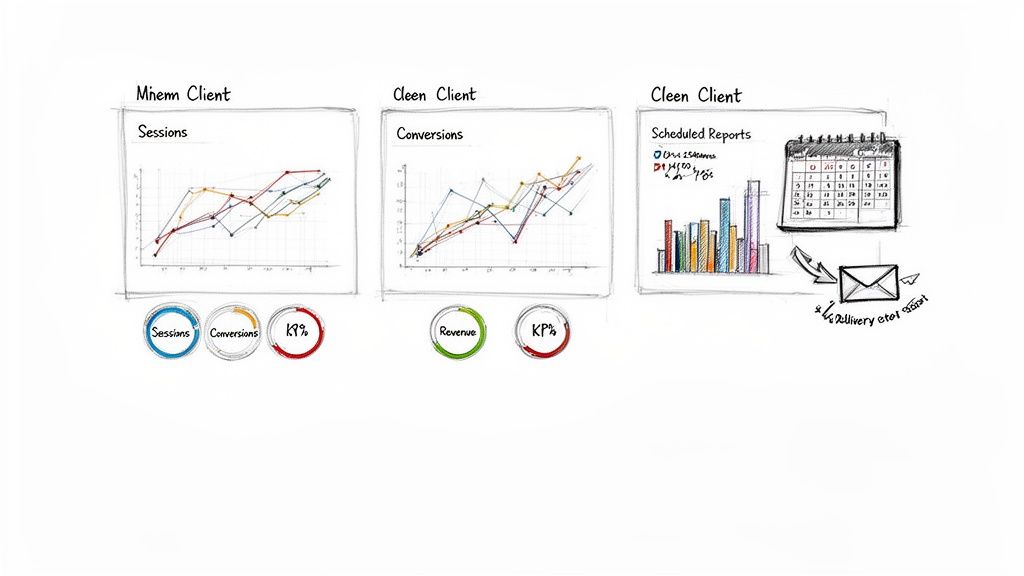
2. Multi-Client Performance Dashboard and Automated Reporting
For marketing agencies, manually pulling data from Google Analytics, Ads, and social media for dozens of clients is a soul-crushing, error-prone task. Automated reporting is a perfect example of data-driven decision making that swaps tedious spreadsheet work for streamlined, consistent client communication. It allows agencies to focus on strategy and analysis instead of just data collection.
This process involves consolidating key performance indicators (KPIs) from multiple platforms into a single, automated report or dashboard. Instead of spending hours each month copying and pasting numbers, teams can deliver professional, white-labeled reports directly to client inboxes on a set schedule. This ensures clients always have the latest data, enabling quicker, more informed discussions about campaign pivots and successes.
Strategic Breakdown
- Business Question: "How can we efficiently and consistently report performance across our entire client portfolio to improve retention and demonstrate value without sinking hours into manual work?"
- Key Metrics & Data Sources:
- Return on Ad Spend (ROAS): From Google Ads, Facebook Ads.
- Cost Per Acquisition (CPA): From various ad platforms.
- Organic Traffic & Goal Completions: From Google Analytics 4.
- Social Media Engagement: (Reach, Likes, Shares) from native social platforms.
- Email Performance: (Open Rate, CTR) from Mailchimp or Klaviyo.
- Expected Outcome: A dramatic reduction in non-billable hours spent on reporting, improved client satisfaction and retention through consistent communication, and a scalable process for onboarding and managing new accounts.
Key Insight: The value isn't just in saving time; it's in standardizing the conversation around data. When clients receive the same, easy-to-read report every week, they learn what metrics matter and can participate more effectively in strategic decisions.
How MetricsWatch Accelerates This Process
MetricsWatch is designed to solve this exact agency bottleneck. It automates the entire reporting workflow, from data compilation to delivery, so you can focus on what clients actually pay you for: your expertise. You can use it to:
- Create Custom Templates: Build a report once and apply it to multiple clients, with data automatically populated for each.
- Schedule Automated Delivery: Send daily, weekly, or monthly performance reports directly to your clients' inboxes as a PDF or in the body of the email.
- White-Label Everything: Add your agency's logo and branding for a professional touch that reinforces your value.
This system transforms reporting from a dreaded chore into a powerful client retention tool. To get started, explore our complete guide on building a white-label reporting system for your agency.
3. Campaign Performance Attribution and ROI Optimization
Pouring your marketing budget into a campaign without knowing its true ROI is like trying to fill a leaky bucket. This is where data-driven attribution modeling becomes a marketer's best friend, moving beyond the simplistic "last-click" model that often gives all the credit to the final touchpoint before a sale. Instead, it analyzes the entire customer journey to see how different channels—paid search, social media, email—work together.
This sophisticated approach allows teams to understand which campaigns are genuinely driving conversions and which are just along for the ride. For instance, an e-commerce brand might discover their Facebook ads are crucial for initial awareness, even if Google Ads gets the final click. This insight allows them to reallocate their budget intelligently, optimizing spend for maximum return instead of just guessing.
Strategic Breakdown
- Business Question: "Which marketing channels and campaigns are most effective at driving conversions and revenue, and how should we adjust our budget to maximize ROI?"
- Key Metrics & Data Sources:
- Assisted Conversions: (How many conversions a channel contributed to but wasn't the last click) from Google Analytics 4.
- Cost Per Acquisition (CPA): (Total campaign cost / number of conversions) from ad platforms like Google Ads and Meta Ads.
- Return on Ad Spend (ROAS): (Revenue generated / ad spend) from GA4 and CRM data.
- Customer Lifetime Value (CLV) by Channel: (Predictive value of customers acquired from specific channels) from CRM platforms like HubSpot or Salesforce.
- Expected Outcome: A more accurate understanding of marketing ROI, leading to smarter budget allocation, reduced wasted ad spend, and a higher overall return on marketing investment.
Key Insight: The modern customer journey isn't a straight line; it's a winding path. Last-click attribution only shows you the finish line, while data-driven attribution gives you the full race map.
How MetricsWatch Accelerates This Process
MetricsWatch simplifies the complex world of attribution by consolidating performance data into clear, automated reports. Instead of manually exporting data from five different platforms, it does the heavy lifting for you. You can use it to:
- Combine Multi-Channel Data: Create a single report that pulls in ROAS from Google Ads, CPA from Facebook, and assisted conversions from GA4 to provide a holistic view.
- Track Channel Performance Over Time: Set up a weekly or monthly report that automatically tracks ROI by channel, making it easy to spot trends and justify budget shifts to clients or stakeholders.
- Automate Client Reporting: Agencies can schedule customized ROI reports for each client, transparently demonstrating the value and impact of their campaigns without spending hours in spreadsheets.
This automation transforms attribution from a complex analytical task into a routine, actionable insight. To dive deeper into this topic, check out our ultimate guide to multi-channel ROI reporting.
4. Customer Segmentation and Personalized Marketing Strategy
Sending the same generic email to your entire list is like shouting into a crowded room and hoping the right person hears you. A far more effective data-driven decision making example is to segment customers based on their behavior, demographics, and engagement patterns. This allows you to tailor messages, offers, and entire experiences to specific groups, making your marketing feel less like a megaphone and more like a one-on-one conversation.
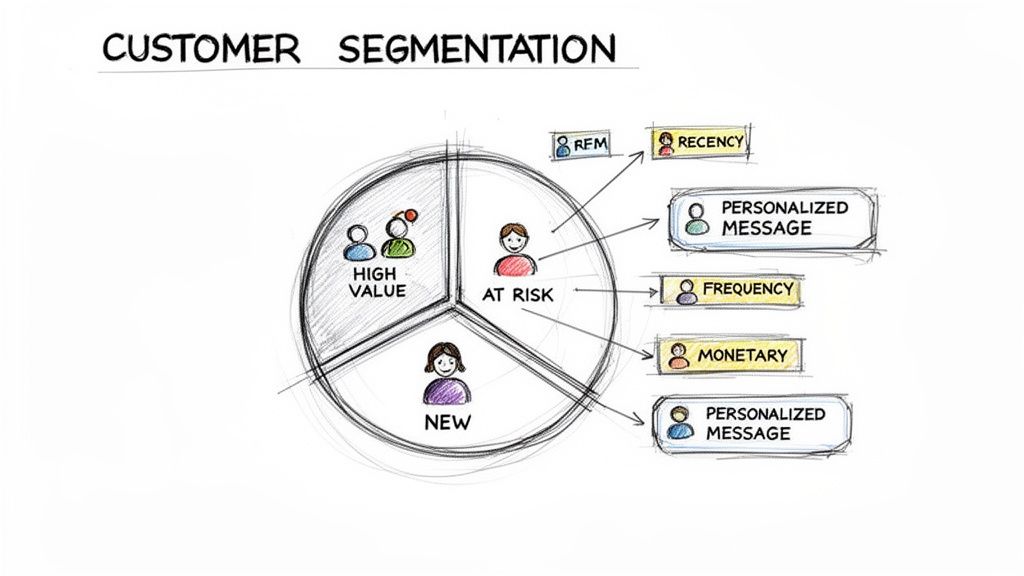
This process involves pulling data from your CRM, Google Analytics, and e-commerce platform to group users. For instance, an e-commerce store might create a segment for "high-value, at-risk" customers who haven't purchased in 90 days. Instead of a generic newsletter, this group gets a targeted "We Miss You" offer. It’s no wonder that segmented campaigns can result in a 760% increase in revenue, according to research from Campaign Monitor. That's not a typo.
Strategic Breakdown
- Business Question: "How can we increase engagement and lifetime value by delivering the right message to the right customer at the right time?"
- Key Metrics & Data Sources:
- Customer Lifetime Value (CLV): Calculated from CRM or e-commerce platform data (e.g., Shopify, BigCommerce).
- Purchase History & Frequency: (Recency, Frequency, Monetary value) from your sales database.
- User Engagement: (Sessions, specific event completions) from Google Analytics 4.
- Demographic Data: (Location, age) from your CRM (e.g., HubSpot, Klaviyo).
- Expected Outcome: Higher conversion rates, increased customer loyalty, and improved marketing ROI by focusing resources on the most responsive and valuable customer segments.
Key Insight: Personalization isn't just about using someone's first name in an email. It's about understanding their journey and anticipating their needs based on past behavior, turning marketing from an interruption into a valuable service.
How MetricsWatch Accelerates This Process
MetricsWatch helps you monitor the health and performance of your key customer segments without getting lost in multiple dashboards. Instead of just building segments, you need to track how they respond over time. You can configure it to:
- Track Segment Performance: Create automated reports that show conversion rates, average order value, and engagement for specific GA4 audiences, like "High-Value Customers" vs. "New Subscribers."
- Monitor Churn Indicators: Set up alerts to get notified if engagement from your "At-Risk" customer segment drops below a certain threshold, prompting your team to launch a retention campaign.
- Report on Campaign Impact: Automatically compare the performance of a personalized campaign against a control group to clearly demonstrate the ROI of your segmentation strategy.
By automating the monitoring of these segments, you can ensure your data-driven personalization efforts are actually driving results, not just creating more work.
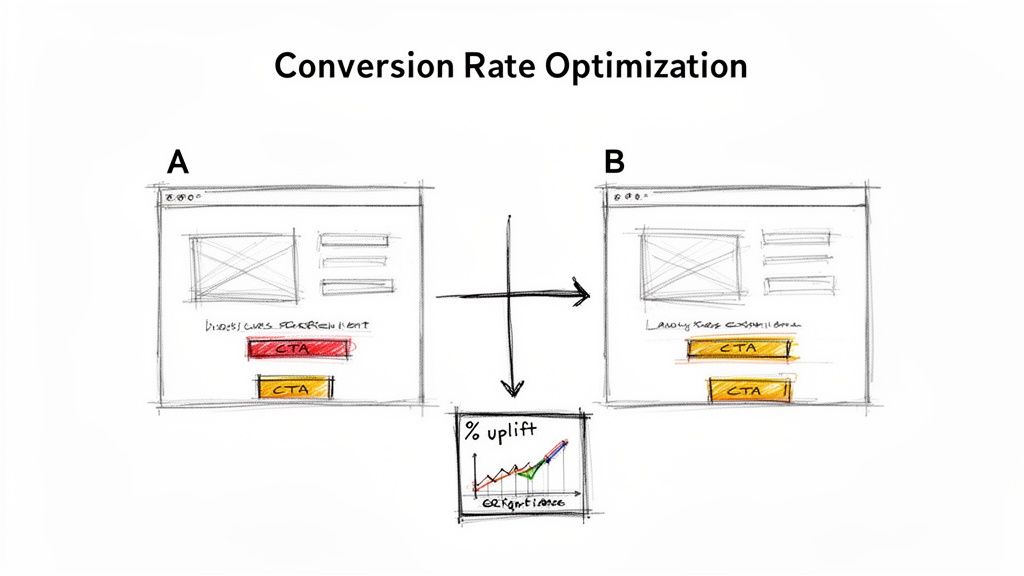
5. Conversion Rate Optimization (CRO) Through A/B Testing and Data Analysis
Guessing what your customers want is a fast track to a low conversion rate. Instead of relying on gut feelings, data-driven teams use A/B testing to let users show them what works. This is a classic example of data driven decision making, where you systematically test changes to a webpage or app to improve a specific metric, most often the conversion rate.
By creating two versions of a page (an "A" and a "B") and showing each to a different segment of your audience, you can collect hard data on which one performs better. A SaaS company might test a green "Sign Up" button against a blue one, while an e-commerce site could test a single-page checkout against a multi-step process. The winning variation, backed by statistical significance, is then rolled out, compounding improvements over time.
Strategic Breakdown
- Business Question: "Which specific changes to our landing pages, CTAs, and user funnels will lead to a statistically significant increase in conversions and revenue?"
- Key Metrics & Data Sources:
- Conversion Rate: (e.g., Trial sign-ups, product purchases, form submissions) from Google Analytics 4 or testing tools like VWO.
- Click-Through Rate (CTR): (On specific buttons or links) from event tracking in GA4.
- Average Order Value (AOV): (For e-commerce tests) from your e-commerce platform analytics.
- Statistical Significance: (The probability that the result is not due to random chance) calculated by your A/B testing platform.
- Expected Outcome: A methodical, iterative process for increasing key conversion metrics, leading to higher revenue, better user engagement, and a deep library of proven customer insights.
Key Insight: Data-driven CRO isn't about finding one "magic bullet." It's about building a system of continuous, incremental improvements that compound into massive gains over the long term.
How MetricsWatch Accelerates This Process
Monitoring the performance of an A/B test and its impact on surrounding metrics is critical. MetricsWatch ensures you have a constant pulse on your key performance indicators during and after a test. You can leverage it to:
- Track Post-Test Performance: After rolling out a winning variation, set up alerts in MetricsWatch to monitor the new baseline conversion rate. You'll be notified immediately if performance unexpectedly drops, which could indicate a technical issue or seasonality.
- Monitor Secondary Metrics: An A/B test might increase sign-ups but hurt another metric like user engagement. Use MetricsWatch reports to get a holistic view, combining data from GA4 and other sources to ensure your "win" didn't cause a loss elsewhere.
- Report Test Results to Stakeholders: Automatically send reports to your team or clients showcasing the uplift from a successful test, clearly communicating the ROI of your CRO efforts.
This transforms A/B testing from a one-off project into a continuously monitored and optimized program, ensuring your hard-won gains are protected.
6. Predictive Analytics for Customer Churn Prevention and Retention
Losing a customer feels awful, and winning a new one is expensive; research from Bain & Company shows that acquiring a new customer costs 5 to 25 times more than keeping an existing one. This is why forward-thinking companies use predictive analytics for churn prevention, a powerful example of data-driven decision making that turns historical behavior into a crystal ball for future actions. It’s about proactively saving at-risk accounts before they even think about leaving.
This approach involves feeding historical customer data into machine learning models to identify patterns that precede cancellations. By analyzing signals like declining product usage, a spike in support tickets, or billing issues, companies can assign a "churn risk score" to each user. This allows retention teams to intervene with targeted outreach, special offers, or educational content to re-engage customers who are quietly slipping away, significantly boosting customer lifetime value.
Strategic Breakdown
- Business Question: "Which of our current customers are most likely to cancel their subscription in the next 30-90 days, and what actions can we take now to retain them?"
- Key Metrics & Data Sources:
- Product Engagement: (Daily/monthly active users, feature adoption rate, session length) from product analytics tools like Mixpanel or Amplitude.
- Customer Support Data: (Ticket volume, resolution time, sentiment analysis) from platforms like Zendesk or Intercom.
- Billing Information: (Failed payments, plan downgrades, credit card expiration dates) from payment processors like Stripe.
- Firmographic/Demographic Data: (Company size, industry, user role) from a CRM like Salesforce.
- Expected Outcome: A measurable decrease in monthly churn rate, an increase in average customer lifetime value (LTV), and a more efficient allocation of retention marketing resources to high-risk, high-value accounts.
Key Insight: Proactive retention is infinitely more effective than reactive "win-back" campaigns. The goal is to solve a customer's problem before they decide cancellation is the only solution.
How MetricsWatch Accelerates This Process
While MetricsWatch doesn't build predictive models, it is essential for monitoring the early warning signs of churn. It acts as your frontline detection system, flagging the behavioral changes that feed into those models. You can configure it to:
- Track Engagement Dips: Set an alert to be notified if a key client's product usage (tracked via Google Analytics goals) drops by more than 30% week-over-week.
- Monitor 'Health Score' Metrics: For agencies, you can track proxy metrics for client health, like lead generation volume or website conversion rates. A sudden drop can signal dissatisfaction.
- Automate Retention Reporting: Include key engagement and conversion metrics in automated reports for customer success teams, giving them a regular pulse on account health without manual data pulls.
By automating the monitoring of these leading indicators, MetricsWatch ensures your team can act on potential churn signals faster, transforming your retention strategy from reactive to preemptive.
7. Content Performance Analytics and Editorial Decision Making
Creating content based on a "gut feeling" is like navigating a maze blindfolded. You might eventually find the exit, but you’ll hit a lot of dead ends first. Content performance analytics flips the script, allowing marketing teams and publishers to use hard data to guide their editorial calendars, a powerful example of data-driven decision making in action.
This approach means moving beyond simple page views. By analyzing metrics like time on page, scroll depth, and, most importantly, which articles drive actual leads or sign-ups, teams can double down on what works. A SaaS company might discover that their "How-To" guides generate 75% more trial sign-ups than their "Industry News" posts, signaling a clear path for future content creation. This transforms the content team from a cost center into a predictable revenue driver.
Strategic Breakdown
- Business Question: "Which content topics, formats, and authors are most effective at engaging our target audience and driving conversions, and how can we use that data to plan our editorial calendar?"
- Key Metrics & Data Sources:
- Engagement Metrics: (Time on page, scroll depth, new vs. returning users) from Google Analytics 4.
- Traffic Sources: (Organic search, social, referral traffic per article) from GA4.
- Conversion Data: (Goal completions, lead magnet downloads, demo requests) attributed to specific blog posts via GA4 Events or UTM parameters.
- Keyword Performance: (Top ranking keywords per article) from Google Search Console.
- Expected Outcome: A more effective content strategy that produces higher audience engagement, generates more qualified leads, and delivers a greater return on investment by focusing resources on proven content themes and formats. To ensure your content is truly effective, it's vital to regularly analyze content performance, tracking metrics like views, engagement, and conversions to refine your strategy.
Key Insight: Great content doesn't just attract eyeballs; it drives action. The goal is to connect the dots between what people read and what they do next, building an editorial strategy that systematically guides readers from curiosity to conversion.
How MetricsWatch Accelerates This Process
MetricsWatch is your content strategy co-pilot, automating the data collection and reporting needed to make smart editorial choices. Instead of manually pulling reports from five different tools, you can:
- Create Content Performance Dashboards: Build a single, automated report sent via email that shows top-performing articles by page views, time on page, and conversions from GA4.
- Track Author Performance: Easily set up reports that filter content performance by author, providing clear data for feedback and resource allocation.
- Monitor Keyword Impact: Integrate Google Search Console data to see which keywords are driving the most traffic to your best articles, spotting new opportunities for content clusters.
This automation gives your editorial team direct access to the insights they need, allowing them to spend less time crunching numbers and more time creating content that resonates and converts.
8. Paid Search and Social Media Budget Optimization Using Performance Data
Pouring money into a digital ad campaign without checking its performance is like trying to fill a bucket with a hole in it. This is where data-driven budget optimization steps in, transforming your ad spend from a hopeful guess into a calculated investment. Instead of setting a budget and forgetting it, marketers use real-time performance data to shift funds from wasteful campaigns to those that actually make money.
This practice involves constantly analyzing metrics from platforms like Google Ads and Facebook Ads. When an e-commerce company sees one ad set delivering a 10x Return on Ad Spend (ROAS) while another barely breaks even, they can instantly reallocate the budget. This dynamic approach ensures every dollar is working its hardest to drive conversions, whether it's for a SaaS company moving funds to lower Cost-Per-Acquisition (CPA) keywords or an agency maximizing a client's seasonal campaign ROI.
Strategic Breakdown
- Business Question: "How can we dynamically allocate our paid media budget across different channels, campaigns, and ad groups to maximize our overall return on investment?"
- Key Metrics & Data Sources:
- Return on Ad Spend (ROAS): (Conversion value / Cost) from Google Ads, Facebook Ads Manager.
- Cost Per Acquisition (CPA): (Total cost / Total conversions) from your ads platform.
- Click-Through Rate (CTR): (Clicks / Impressions) from ads platforms and Google Search Console.
- Conversion Rate: (Conversions / Clicks or Sessions) tracked via GA4 and imported into ads platforms.
- Expected Outcome: A significant increase in overall campaign profitability and efficiency, a lower cost per lead or sale, and the elimination of wasted ad spend on underperforming assets.
Key Insight: The goal is to treat your ad budget like a fluid asset, not a fixed cost. Constant, small adjustments based on real-time data compound into massive efficiency gains over time.
How MetricsWatch Accelerates This Process
Manually checking ROAS and CPA across dozens of campaigns is a recipe for missed opportunities. MetricsWatch automates the monitoring so you can focus on the strategy. You can configure it to:
- Set Performance Alerts: Get an immediate Slack notification if a key campaign's CPA increases by more than 20% overnight, allowing for a quick budget pause or adjustment.
- Track ROAS Thresholds: Receive an email alert when a high-performing ad set drops below a target ROAS, signaling that it may be experiencing ad fatigue.
- Consolidate Client Reporting: Agencies can combine Google Ads, Facebook Ads, and GA4 data into a single, automated report to show clients exactly how their budget is being optimized for performance.
This automated oversight ensures you’re always making budget decisions based on the freshest data, not last week’s report.
9. Product Development Decisions Based on User Behavior Analytics
Guessing which new feature will become a user favorite versus which one will become digital dust is a high-stakes gamble. This is why modern product teams rely on user behavior analytics, a prime example of data-driven decision making that replaces gut feelings with hard evidence. Instead of building features based on what the loudest customer wants, teams analyze how users actually interact with the product to guide the roadmap.
This approach involves tracking every click, scroll, and user flow to understand what’s working and what isn’t. By analyzing feature adoption rates, usage frequency, and user journeys, teams can pinpoint underused features ripe for removal or redesign. SaaS companies use this data to validate hypotheses, identify high-value feature combinations that boost retention, and confidently prioritize their development efforts, ensuring they build products people truly need.
Strategic Breakdown
- Business Question: "Which features should we build, improve, or deprecate next to increase user retention and product value?"
- Key Metrics & Data Sources:
- Feature Adoption Rate: (Percentage of users trying a new feature) from product analytics tools like Mixpanel or Amplitude.
- Usage Frequency: (How often a specific feature is used) from internal databases or platforms like Heap.
- User Retention by Cohort: (Percentage of users who remain active after using a specific feature) from product analytics.
- User Flows: (Common paths users take through the app) to identify friction points and opportunities.
- Expected Outcome: A more efficient product development cycle with reduced risk, higher user engagement, and a product roadmap directly aligned with user needs, leading to improved customer retention.
Key Insight: Your most valuable product feedback isn't what users say in surveys; it's what they do inside your product every day. Their behavior is the ultimate source of truth for your roadmap.
How MetricsWatch Accelerates This Process
While product analytics tools are great for deep dives, MetricsWatch ensures the core business impact of these features is never missed. It bridges the gap between product behavior and marketing performance. You can use it to:
- Track Feature Impact on Goals: Set up automated reports that correlate the rollout of a new feature with changes in key Google Analytics goals, like trial sign-ups or subscription upgrades.
- Monitor Segment Performance: Create alerts to notify you if a feature launch negatively impacts the conversion rate of a key user segment, like "New Users from Organic Search."
- Consolidate Key Funnels: Include data on user progression through critical funnels in your daily or weekly marketing reports, giving all stakeholders a clear view of product health.
This turns raw user behavior data into actionable business intelligence, helping your entire team understand how product changes directly influence the bottom line.
10. Data Quality Monitoring and Analytics Governance for Decision Confidence
Making a huge business decision based on bad data is like trying to navigate a new city using a map drawn on a napkin by a toddler. It's not going to end well. This is why top-tier organizations treat data quality not as a chore, but as a critical foundation for every single one of their data-driven decision-making examples. Without it, everything else is just guesswork.
This practice involves creating automated systems to continuously audit your analytics setup. It's about catching issues like a broken GA4 tracking code, a misconfigured e-commerce event, or a sudden data blackout before it pollutes your reports and leads to disastrously wrong conclusions. By establishing strong analytics governance, you ensure every stakeholder, from the marketing intern to the CEO, can trust the numbers they're seeing.
Strategic Breakdown
- Business Question: "How can we guarantee our analytics data is accurate, complete, and trustworthy, so we can make high-stakes business decisions with confidence?"
- Key Metrics & Data Sources:
- Data Completeness: (Absence of "zero-traffic" days) from GA4 or Adobe Analytics.
- Implementation Integrity: (Correct event firing, custom dimension population) verified through Google Tag Manager debug mode and GA4 Realtime reports.
- Conversion Tracking Accuracy: (Matching GA4 revenue with platform revenue, e.g., Shopify) from both analytics and e-commerce platforms.
- Configuration Health: (Filter settings, channel groupings, referral exclusion lists) from GA4 Admin settings.
- Expected Outcome: Dramatically increased confidence in analytics data, prevention of flawed strategic decisions based on inaccuracies, and faster resolution of tracking errors, preserving data integrity for long-term analysis.
Key Insight: Data quality isn't a one-time setup; it's an ongoing process. A perfectly configured analytics account today can become a source of misinformation tomorrow due to a simple website update or plugin conflict.
How MetricsWatch Accelerates This Process
MetricsWatch acts as your first line of defense for data governance, automating the tedious task of manual health checks. For comprehensive data quality and analytics governance, exploring dedicated Business Intelligence tools is a smart move, but MetricsWatch provides immediate, actionable alerts. You can configure it to:
- Flag Data Gaps: Set up an alert to instantly notify you if your primary GA4 property reports zero sessions for more than an hour, signaling a major tracking failure.
- Monitor Client Implementations: Agencies can create a "zero revenue" alert for key e-commerce clients, ensuring a broken checkout tracking pixel is caught immediately.
- Catch Anomalous Spikes: Get a notification if bot traffic suddenly inflates your user count, allowing you to apply filters before it skews performance reports.
This automated oversight ensures your data remains a reliable asset, not a potential liability, empowering your team to act decisively and accurately.
10-Point Comparison of Data-Driven Decision Examples
| Solution | Implementation complexity | Resources required | Expected outcomes | Ideal use cases | Key advantages |
|---|---|---|---|---|---|
| Real‑Time Website Performance Monitoring and Anomaly Detection | Medium–High — requires anomaly models and alert tuning | Real‑time data pipeline, monitoring tools (MetricsWatch/Datadog), analytics engineers | Minutes‑level issue detection, reduced downtime and data gaps | E‑commerce during campaigns, SaaS, agencies monitoring many sites | Prevents revenue loss, immediate alerts, reduces manual monitoring |
| Multi‑Client Performance Dashboard and Automated Reporting | Medium — template setup and multi‑source connections | Dashboard/reporting tools (Looker Studio, Supermetrics), API access, report templates | Automated scheduled reports, significant time savings | Digital agencies, freelance analysts, in‑house multi‑brand teams | Saves analyst hours, consistent client communication, white‑labeling |
| Campaign Performance Attribution and ROI Optimization | High — multi‑touch modeling and cross‑channel integration | Clean tracking, CRM integration, attribution tools, analytics/modeling skills | Clearer channel ROI, better budget allocation | E‑commerce, SaaS, performance marketing teams | Reveals true campaign impact, optimizes marketing spend |
| Customer Segmentation and Personalized Marketing Strategy | Medium–High — data integration and evolving segments | CRM + analytics, segmentation tools (Klaviyo/HubSpot), data engineering | Higher conversion rates and customer LTV through targeted messaging | E‑commerce, subscription services, SaaS | Personalization improves engagement and LTV |
| Conversion Rate Optimization (CRO) via A/B Testing | Medium — experiment design and significance measurement | A/B testing platform (Optimizely/VWO), sufficient traffic, analytics | Incremental conversion uplift, validated UX improvements | Landing pages, checkout flows, pricing and lead forms | Data‑driven improvements, revenue gains without more traffic |
| Predictive Analytics for Churn Prevention and Retention | High — ML models and continuous retraining | Historical customer data, ML expertise, retention tooling (Gainsight/Intercom) | Early identification of churn risk, reduced churn rates | SaaS, subscription services, telecom | Enables proactive retention, improves customer lifetime value |
| Content Performance Analytics and Editorial Decision Making | Low–Medium — tracking and topic analysis | GA4, content analytics (Parse.ly/Chartbeat), editorial dashboards | Better editorial prioritization, improved engagement metrics | Publishers, content marketing teams, SaaS blogs | Identifies high‑ROI topics, informs publishing roadmap |
| Paid Search & Social Budget Optimization Using Performance Data | Medium–High — frequent adjustments and automation | Ads platforms, ROAS/CPA tracking, bid management tools (Kenshoo/Marin) | Improved ROAS, reduced wasted spend, agile budget shifts | E‑commerce, performance agencies, seasonal campaigns | Dynamic budget allocation, rapid reallocation to high‑ROI channels |
| Product Development Decisions Based on User Behavior Analytics | Medium — event instrumentation and cohort analysis | Product analytics (Amplitude/Mixpanel), event tracking, UX research | Data‑informed prioritization, reduced build risk, validated features | SaaS product teams, mobile apps, B2B platforms | Prioritizes high‑impact features, improves product‑market fit |
| Data Quality Monitoring and Analytics Governance for Decision Confidence | Medium–High — continuous monitoring and governance processes | Data quality tools, analytics audits, governance framework, technical expertise | Trusted data, fewer bad decisions, faster issue resolution | Any org relying on analytics; especially agencies, e‑commerce, SaaS | Ensures data integrity, builds stakeholder confidence |
Your Turn: Make Data Your Superpower
Phew, that was a lot of ground to cover. We've journeyed through ten distinct data driven decision making examples, from detecting website anomalies in real-time to using user behavior analytics to guide product development. We saw how e-commerce brands use A/B testing for CRO, how marketing agencies optimize multi-client ad budgets, and how SaaS companies can predict and prevent customer churn. It's a wide world of data out there, but you don't need a PhD in statistics to navigate it.
The core theme connecting all these examples is surprisingly simple: data-driven decision-making isn't a mystical art. It’s a practical, repeatable process of asking the right questions, looking at the right numbers, and having the courage to act on what you find. It's about trading "I think" for "the data shows."
From Guesswork to Growth: The Core Takeaways
Across all the strategies we discussed, from customer segmentation to content performance analytics, a few key principles emerged as non-negotiable for success:
- Clarity is King: Every powerful data initiative begins with a crystal-clear business question. "How can we increase sales?" is vague. "Which of our top three traffic sources has the highest lead-to-customer conversion rate for our new service offering?" is a question you can actually answer.
- Automation is Your Ally: Manually pulling reports is a soul-crushing time-suck that leads to burnout, not breakthroughs. Automating your reporting and setting up alerts for key metric changes frees your brain to focus on strategy and analysis, not tedious data entry. This is where you gain leverage.
- Action is the Goal: Data is useless without action. Insights sitting in a dashboard are just expensive pixels. The entire point of this process is to inform a change, whether it's reallocating a budget, personalizing an email campaign, or killing a feature that nobody uses.
The value of embracing this mindset is enormous. According to a landmark study by McKinsey, organizations that extensively use customer analytics and data-driven insights report a 126% profit improvement over their competitors. That’s not a small jump; it’s a complete game-changer that separates market leaders from the laggards.
Your First Step into a Data-Driven World
Feeling overwhelmed? Don't be. You don't have to implement all ten of these data driven decision making examples by next Tuesday. The journey from guessing to knowing starts with a single step and a single metric.
Here’s your action plan:
- Pick One Battle: Choose just one example from this list that feels most relevant and achievable for your business right now. Is it optimizing your top-performing blog posts? Or maybe A/B testing your checkout page button color?
- Define Your Metric: Identify the one or two Key Performance Indicators (KPIs) that will tell you if you're succeeding. For the blog post, it might be "time on page" or "newsletter signups." For the checkout button, it's "click-through rate."
- Set Up Your System: This is the crucial part. Implement the tracking needed to measure your chosen KPI. More importantly, build a system to monitor it consistently and alert you to significant changes. This prevents you from having to remember to check it every day.
The goal is to build a small, repeatable data habit. Once you prove the value in one area, you'll gain the confidence and the momentum to apply this powerful approach across your entire organization. You already have the data; now it’s time to make it work for you. Go find your first metric.
Tired of manually pulling numbers and wrestling with spreadsheets? MetricsWatch automates your reporting and sends critical alerts directly to your inbox, so you can stop chasing data and start making decisions. See how our automated reporting can support your data-driven strategy at MetricsWatch.


