Real Time Website Monitoring: A Guide for People Who Hate Bad News

Real-time website monitoring is a fancy term for something super simple: watching your website's every move, every single second.
Think of it as a smoke detector for your website. You don't just want to know if your site is a smoldering crater (aka offline). You want to catch the slow pages, busted forms, and "where did all my visitors go?" traffic drops the second they happen. This constant watchfulness is what stops tiny glitches from turning into full-blown, wallet-emptying disasters.
Why Your Website Needs a 24/7 Watchdog (Who Never Sleeps)
You know that stomach-plummeting feeling when a customer kindly points out your website is broken? Yeah, it’s the worst. An unmonitored website is like a toddler with a permanent marker—you only find the masterpiece of chaos after the damage is done. Relying on customer complaints to find problems isn't a strategy; it's a cry for help.
Let’s try an analogy. Imagine you own a busy coffee shop. You’d want to know instantly if the espresso machine explodes, not find out from a day's worth of angry, caffeine-starved customers. Real-time website monitoring is that instant alert. It’s your digital store manager, constantly checking to make sure everything is humming along.
Moving from Reactive Panic to Proactive Peace
Without monitoring, you're always in reactive mode. You're scrambling to fix problems that have already cost you money and made your users question their life choices. Here’s a fun fact: a 2022 survey by LogicMonitor found that 96% of global IT leaders had experienced at least one outage in the past three years. So yeah, it's not a matter of if, but when. It's about shifting your mindset from "I hope the site is okay" to "I'll know the second it's not."
This proactive approach means you can:
- Fix problems before most users notice: Catching a slow checkout process in minutes instead of hours prevents cart abandonment.
- Protect your brand reputation: A reliable website builds trust. A glitchy one sends customers running to your competitors.
- Make data-driven decisions: Understand performance trends instead of guessing why sales suddenly dropped last Tuesday.
The core idea of real-time website monitoring is simple: stop finding out about problems from angry customers. By the time a user reports an issue, the damage to your revenue and reputation is already done.
The Real-World Impact of Being Unprepared
The consequences of not monitoring your site are painfully real. A slow-loading page, a broken contact form, or a complete outage can have immediate financial consequences. A minor slowdown might not seem like a big deal, but it adds up quickly.
Ultimately, this constant oversight isn't just some technical chore; it's a fundamental business practice. It’s the essential, stress-reducing sidekick every website owner needs to ensure their digital presence is always working for them, not against them.
The Hidden Costs of Website Downtime
Let's cut right to the chase: when your website stumbles, your wallet feels it. This isn't just about a few lost sales, either. Website downtime and poor performance are silent killers of revenue, trust, and momentum. It's the digital equivalent of locking the doors to your store in the middle of a busy day.
You've probably heard the term "99.9% uptime." Sounds incredible, right? Almost perfect. But when you do the math, that seemingly stellar number means your digital storefront is closed for business for nearly 45 minutes every single month. Now, imagine that downtime hits during a flash sale, a product launch, or your peak season. Ouch.
The financial bleed is almost always worse than businesses realize. According to Statista, the average cost of downtime per hour in 2021 was over $300,000 for 25% of respondents. You can dive deeper into the full impact with these network monitoring statistics from Motadata.com.
From Slow Pages to Lost Customers
It’s not just about your site going completely dark. Those sneaky slowdowns—what we call performance degradation—can be just as damaging. Modern customers are famously impatient. In fact, a simple one-second delay in page load time can tank your conversions by 7%, according to research from the Nielsen Norman Group.
Think about it. If your e-commerce site takes an extra few seconds to load, potential buyers don't just sit around and wait. They bounce, heading straight to a competitor who offers a smoother, faster experience. Suddenly, that minor technical hiccup has cost you a customer for life.
Slow is the new down. Your website can be technically "online," but if it's too slow to use, it's effectively offline for your customers. This is where real-time website monitoring becomes an investment, not an expense.
The Domino Effect of Poor Performance
The costs spiral outward, hitting more than just your immediate sales figures. A clunky website creates a domino effect that can cripple your business from multiple angles. It's crucial to see the whole picture.
Here are just a few of the hidden costs that often get missed:
- Wasted Ad Spend: Running Google Ads or social media campaigns? Every click you pay for that leads to a slow or broken page is money thrown directly into a digital black hole.
- Damaged Brand Reputation: A glitchy, unreliable website screams unprofessionalism. It erodes customer trust, making them question the quality of your products and services. Once that trust is gone, it's incredibly difficult to win back.
- Tanking SEO Rankings: Search engines like Google prioritize user experience. A slow or frequently unavailable site sends strong negative signals, causing your search rankings to plummet and organic traffic to dry up.
Shifting from Damage Control to Growth
When you’re constantly putting out fires, you have no time to focus on what actually moves the needle: growing your business. Every hour your team spends diagnosing a crash is an hour they aren't spending on innovation, marketing, or customer service.
This is the ultimate argument for proactive real-time website monitoring. It’s not about adding another tool to your tech stack. It's about protecting your revenue, safeguarding your brand, and freeing up your team to focus on building a better business. It turns a reactive, stressful process into a controlled, proactive strategy for success.
Understanding the Metrics That Actually Matter
Trying to track every single metric your website coughs up is a one-way ticket to a massive headache. It's like standing in a crowded stadium and trying to listen to every single conversation at once—all you'll get is noise, not insight. The real secret to effective real time website monitoring is zeroing in on the vital signs that actually tell you if your site is healthy or not.
This isn't about building a dashboard that looks like a spaceship cockpit, crammed with blinking lights and confusing charts. The goal is to create a simple, clean view that tells you one of two things: "Everything is great," or "Houston, we have a problem."
Moving Beyond Simple Uptime
The most basic metric is uptime. It just answers one question: "Is my website online?" While that's obviously critical, it's really just the tip of the iceberg. A site can be technically "up" but so painfully slow or broken that it’s completely useless to anyone trying to visit. That's why we need to dig a little deeper.
A great place to start is with the metrics that impact user experience, which often hide behind some intimidating acronyms. Let's break a couple of them down.
- Time to First Byte (TTFB): Think of TTFB like how quickly a waiter greets you at your table. A slow start sets a bad tone for the whole meal. If your server is sluggish, your website is already failing that crucial first impression test.
- Largest Contentful Paint (LCP): This is how long it takes for the main course to arrive. LCP measures when the most important stuff on the page—like the big hero image or the main headline—actually becomes visible. If this takes too long, your hungry visitor is likely to just get up and find another restaurant.
These performance metrics aren't just nice-to-haves; they're non-negotiable. People abandon slow sites in a heartbeat. According to Google, the probability of a user bouncing increases by 32% as page load time goes from 1 to 3 seconds. And a tiny 100ms delay in load time? That can slash conversion rates by a whopping 7%.
Key Monitoring Metrics You Can't Ignore
To keep you from drowning in data, let's focus on a handful of actionable KPIs that tie directly to your business goals. When something goes wrong with one of these, you'll know it's time to pay attention.
The table below breaks down the essential metrics that give you a clear, comprehensive view of your website's health, from server status to the all-important user experience.
| Metric Category | What It Measures | Why It Matters |
|---|---|---|
| Page Load Speed | How quickly your pages become usable for visitors. | Slow pages kill conversions and tank your SEO rankings. Even a one-second delay can send customers straight to your competitors. |
| Transaction Success Rates | The percentage of successful checkouts, form submissions, or sign-ups. | A sudden drop here is a direct signal that a bug is lurking in your most critical user journeys, costing you real money every minute. |
| 404 Error Spikes | A sudden, sharp increase in "Page Not Found" errors. | This often points to broken links from a recent update, a bad URL in a marketing campaign, or even malicious bot activity. |
| JavaScript Error Rates | The frequency of script errors that break site functionality. | These are the silent killers. They can stop buttons from working or prevent content from loading, creating a massively frustrating experience. |
These are the core metrics that tell the real story. For instance, getting on top of script errors is crucial for a healthy site. If you want to dig deeper, there are great guides on proactively handling JavaScript errors to keep everything running smoothly.
The Ultimate "Something Is Wrong" Alert
Finally, one of the most powerful—and frankly, terrifying—signs of a major problem is a sudden, unexplained drop in your traffic. If you glance at Google Analytics and see your visitor numbers have fallen off a cliff, that’s a massive red flag.
A "zero traffic" alert is the digital equivalent of a flatline. It could mean your analytics tracking code broke, your entire site is down, or—worst case—you've been de-indexed by Google. It’s the ultimate signal that something is catastrophically wrong.
By focusing on these core metrics, you get a powerful, uncluttered view of your website's health. It allows you to build a dashboard that gives you clear, immediate insights so you can act fast when it truly matters. For more ideas on what to track, check out our guide on the 10 key website traffic metrics for 2025.
How Real Time Website Monitoring Actually Works
Alright, let's pull back the curtain on real time website monitoring. Don't worry, you won't need an engineering degree for this part. It might sound like digital wizardry, but how these tools keep an eye on your site usually boils down to two clever approaches.
Think of it like running a popular restaurant. You need a way to check on quality before customers complain, but you also need to know what they're actually experiencing. The same logic applies here, and these two methods work best when used together.
Synthetic Monitoring: The Secret Shopper
First up is Synthetic Monitoring. This is like hiring a team of very dedicated, very fast robots to act like customers and test your website 24/7. These robotic "users" run scripted tests from different locations all over the world, constantly checking if everything is working as it should.
These tests can be simple or surprisingly complex.
- Simple Checks: Is the homepage loading? Is the site even online? This is the most basic "are the lights on?" test.
- Complex Journeys: Can a user add an item to their cart? Can they log into their account? These scripts mimic critical user paths to ensure your most important features aren't broken.
The beauty of this method is that it's proactive. Since these are simulated tests, you often find out about a problem before a real human visitor ever stumbles upon it. It's your early warning system, letting you fix a wobbly table before your dinner guests arrive.
Real User Monitoring: The Customer Feedback Card
While synthetic tests are great for catching obvious breaks, they can't tell you what every single visitor actually experiences. That’s where Real User Monitoring (RUM) comes in.
RUM is like having a secret agent report back on every real visitor's session—the good, the bad, and the painfully slow.
Instead of running a script, RUM collects performance data directly from the web browsers of your actual users. This gives you the unvarnished truth about how your site performs in the wild, on all the different devices, browsers, and internet connections people use. To understand the practical benefits of implementing such systems, exploring how real time traffic monitoring improves your site's performance is a great next step.
RUM tells you what real people are experiencing right now. It answers questions like, "Why is the checkout page taking ten seconds to load for users in Australia on their iPhones?" You get real-world data, not just lab results.
This infographic breaks down the fundamental pillars of website health that both monitoring types help track.
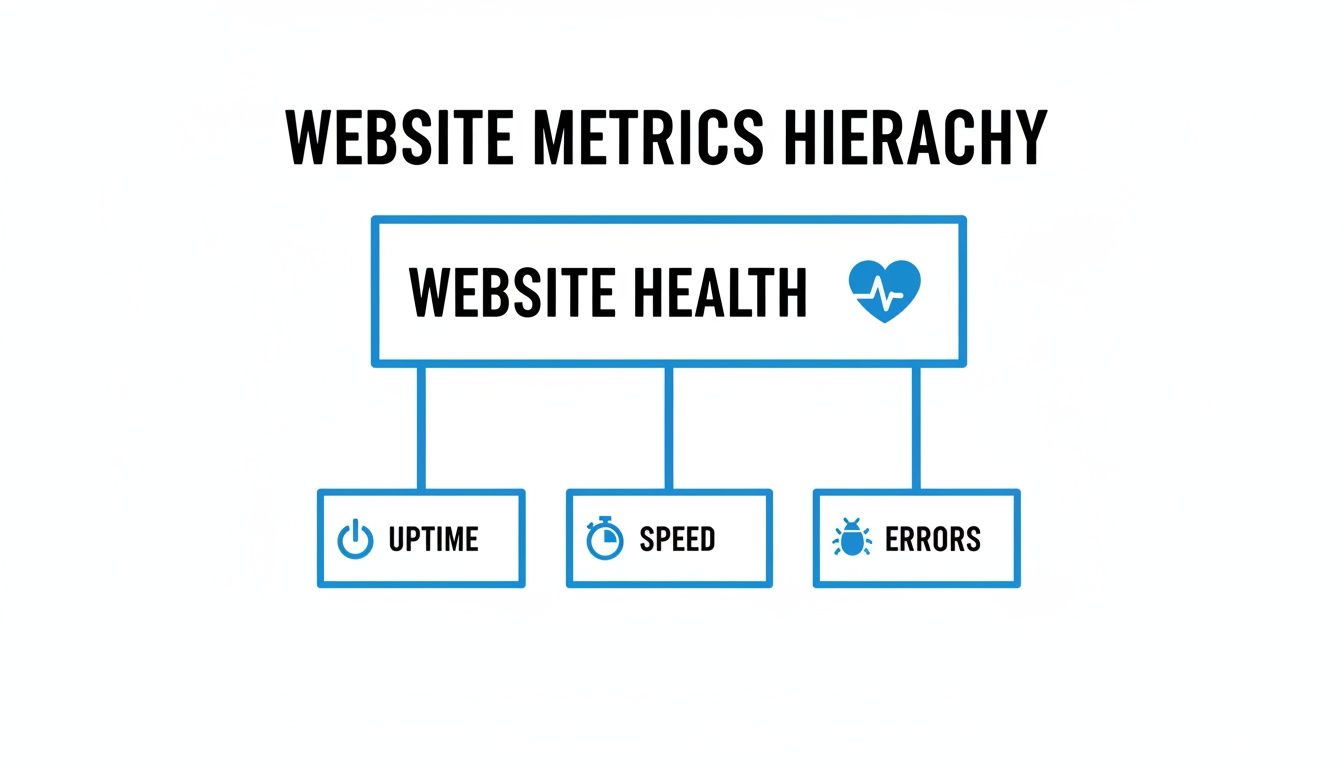
As the diagram shows, a truly healthy website isn't just "up"; it's also fast and free of errors. These are the exact insights a combined monitoring strategy provides.
By blending the proactive checks of synthetic monitoring with the real-world evidence from RUM, you get a complete picture of your website’s performance, leaving no stone unturned.
Choosing the Right Monitoring Toolkit
Picking the right real time website monitoring tool can feel a bit like trying to choose a show on Netflix. You scroll through endless options, they all look kind of the same, and you end up just re-watching The Office. But don't worry, finding the perfect fit is way easier once you know what to look for.
The secret isn’t finding the tool with the most features; it’s finding the tool with the right features for you. A tool that’s perfect for a massive e-commerce giant might be total overkill for a small marketing agency, and vice-versa. It all comes down to your specific needs, your team’s workflow, and what data you trust the most.
To get started, let’s play a quick game. Not twenty questions, more like four, but you get the idea.
Asking the Right Questions
Before you even look at a single pricing page, grab a coffee and ask yourself these simple questions. Your answers will act as a filter, immediately knocking out 90% of the options that aren’t a good match.
What’s My Biggest Fear? Are you terrified of your payment gateway breaking during a flash sale? Or is your nightmare a sudden traffic drop right after launching a huge campaign? Pinpoint your single biggest point of failure.
Who Needs to Know? When things go south, who gets the frantic "THE SITE IS DOWN" message? Is it a single developer, a whole marketing team via Slack, or an account manager who needs to update a client? Your alert system should fit your communication style.
What’s My Source of Truth? Do you live and breathe inside Google Analytics? Or is your team more focused on server logs and infrastructure metrics? The right tool should plug directly into the data you already rely on.
How Much Noise Can I Tolerate? Are you okay with getting a dozen alerts for minor blips, or do you only want to be notified when something is seriously wrong? Some tools are notoriously chatty, leading to "alert fatigue" where real emergencies get ignored.
These questions help you define what you truly need from a monitoring toolkit. If you're still exploring the landscape, our guide on different website performance monitoring tools offers a broader look at the options available.
Why Google Analytics Data Is a Goldmine
For many businesses, especially those in marketing and e-commerce, Google Analytics isn’t just a tool; it’s the heartbeat of their online presence. It tells you who is visiting, what they’re doing, and whether they’re buying. So, why not use that rich, business-critical data as the foundation for your monitoring?
This is where a solution like MetricsWatch comes in. Instead of adding another layer of complex synthetic checks, it plugs directly into your Google Analytics account. This approach has a huge advantage: the alerts are based on what your actual users are experiencing.
If your Google Analytics traffic suddenly drops to zero, it’s not a false alarm. It’s a five-alarm fire. Tying alerts to core business metrics eliminates the noise and ensures that when you get a notification, it’s for something that directly impacts your bottom line.
A Stress-Free Approach to Monitoring
MetricsWatch is designed for teams who need actionable insights without the technical overhead. It focuses on a simple but powerful premise: automate alerts based on significant changes in your GA data. You get zero-false-positive notifications that tell you if sales have plummeted, conversions have stopped, or traffic has vanished.
This is especially crucial in today's crowded web. With over 1.13 billion websites in existence (though only about 17% are active, according to Siteefy), standing out is tough enough without your site breaking. The pace is frantic. Learn more about the scale of the web from these incredible website statistics.
By focusing on your core analytics, you can cut through the noise and get straight to what matters. This makes real time website monitoring less of a chore and more of a superpower, giving you the peace of mind to focus on growing your business.
Setting Up Your First Monitoring Alert
Alright, enough with the theory. Let's get our hands dirty. This is the moment you officially switch from worrying about website problems to actively preventing them. Setting up your first alert is surprisingly straightforward, and honestly, it feels a bit like setting a brilliant, automated trap for bugs.
The goal isn't to get spammed with notifications for every tiny blip on the radar. Smart real time website monitoring is all about creating meaningful alerts. Forget a vague "something's slow" message. You want an alert that tells a story, like: "Notify me if sales drop more than 30% compared to this time last week."
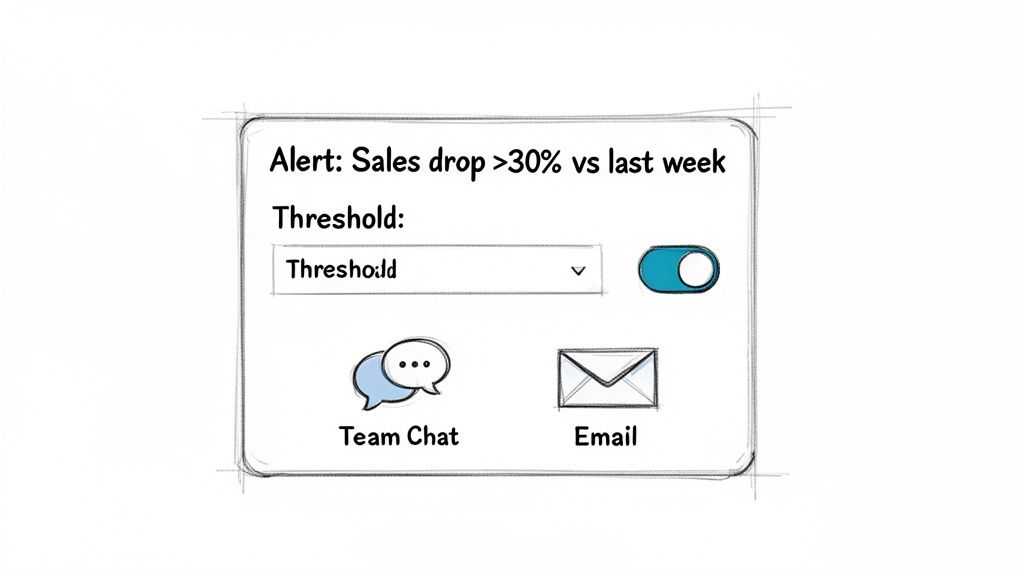
This is the critical difference between noise and signal. Meaningful alerts are your best defense against "alert fatigue"—that dangerous place where your team gets so many notifications they start ignoring them all, even the important ones.
Creating a Critical Alert in Under Five Minutes
Let's walk through a real-world example using a tool like MetricsWatch, which hooks directly into your Google Analytics data. One of the scariest (and most important) things to watch for is your traffic completely vanishing. It happens more than you'd think.
Here’s how you can set up a "zero traffic" alert to catch this catastrophe the second it happens:
- Connect Your Data Source: First, securely link your Google Analytics account. This is usually just a few clicks—no code, no fuss.
- Choose Your Metric: Pick the metric you want to watch like a hawk. In this case, you'd choose something like "Sessions" or "Users."
- Define the "Oh No" Threshold: This is the fun part. You set the rule. A simple but incredibly powerful rule is: "Alert me if Sessions are less than 1." This is your digital flatline detector.
- Pick Your Panic Channel: Finally, decide where the emergency broadcast should go. You can send it directly to a specific Slack channel (maybe #website-emergencies?) or straight to key team members via email.
That's it. In about the time it takes to brew a cup of coffee, you’ve created a safety net that protects you from one of the absolute worst-case scenarios.
Setting up a "zero traffic" alert is the single best thing you can do to move from reactive panic to proactive peace of mind. It’s your ultimate defense against silent, site-breaking issues that could otherwise go unnoticed for hours or even days.
Integrating Alerts Where Your Team Already Works
Even the best alerts are useless if they get lost in a cluttered inbox or a forgotten app. The final piece of the puzzle is piping these notifications into the tools your team uses every single day.
When an alert for a massive traffic drop fires directly into your team's main Slack channel, the right people see it instantly. There’s no delay. No chance of it being missed. This immediate visibility is what allows teams to respond in minutes, not hours, turning a potential disaster into a minor hiccup.
If you want more ideas, check out our guide on setting up real-time Google Analytics alerts.
Frequently Asked Questions About Website Monitoring
Got a few questions still rattling around in your head? You're not the only one. Let's tackle some of the most common ones about real-time website monitoring with some refreshingly straight answers. No jargon, just the essentials.
Can I Just Use Google Analytics for Monitoring?
While Google Analytics is fantastic for understanding past performance and spotting trends, it’s not really built to be an emergency alarm system.
Think of it this way: GA is like a history book. It can tell you, in great detail, what happened yesterday. A real-time monitoring tool, on the other hand, is the firefighter screaming that your house is on fire right now. A proper real-time website monitoring tool is built to watch your GA data for you. The second something goes haywire—like your traffic suddenly flatlining—it pings you on Slack or email. It turns your analytics from a history lesson into a first responder.
What Is the Difference Between Uptime and Performance Monitoring?
Good question. It's a simple but crucial distinction. Uptime monitoring just checks if the lights are on. Performance monitoring, on the other hand, checks to see if anyone can actually see anything, or if the lights are flickering so badly that your customers are heading for the exit.
Your website can be technically "up" but so painfully slow that it’s completely unusable. In that same 2022 LogicMonitor study, 55% of IT leaders said the pressure to avoid downtime for customers has never been higher. You absolutely need both uptime and performance monitoring to protect your revenue and keep your hard-earned reputation intact.
A slow website is the new "down." If your site is online but unusable, it might as well be offline. Don’t just check for a pulse; check the vital signs, too.
How Do I Stop Getting Buried in False Alarms?
Ah, the dreaded “alert fatigue.” It’s a real problem. When teams get bombarded with pointless notifications, they start ignoring the ones that actually matter. But the solution isn't to just turn off all your alerts; it's to make them smarter.
Instead of getting pinged for every minor dip, you need to set intelligent thresholds. A great starting point is to compare current data against historical norms. For example: “Alert me only if traffic falls 50% below last week’s average for this specific hour.” A good monitoring tool will also have built-in intelligence to weed out false positives, making sure that when you do get an alert, it’s actually time to jump into action.
Ready to stop reacting to problems and start preventing them? MetricsWatch connects directly to your Google Analytics to provide zero-false-positive alerts on the metrics that matter most. Start your free trial today and set up your first critical alert in under five minutes.


