Search Engine Marketing Reporting That Your Boss Will Actually Read

Let's be honest, search engine marketing reporting sounds about as exciting as watching paint dry. But it's actually your campaign's origin story—the part where you turn a jumble of confusing numbers into a clear tale of what's working, what isn't, and where your money is really going.
Your Campaign's Superhero Origin Story
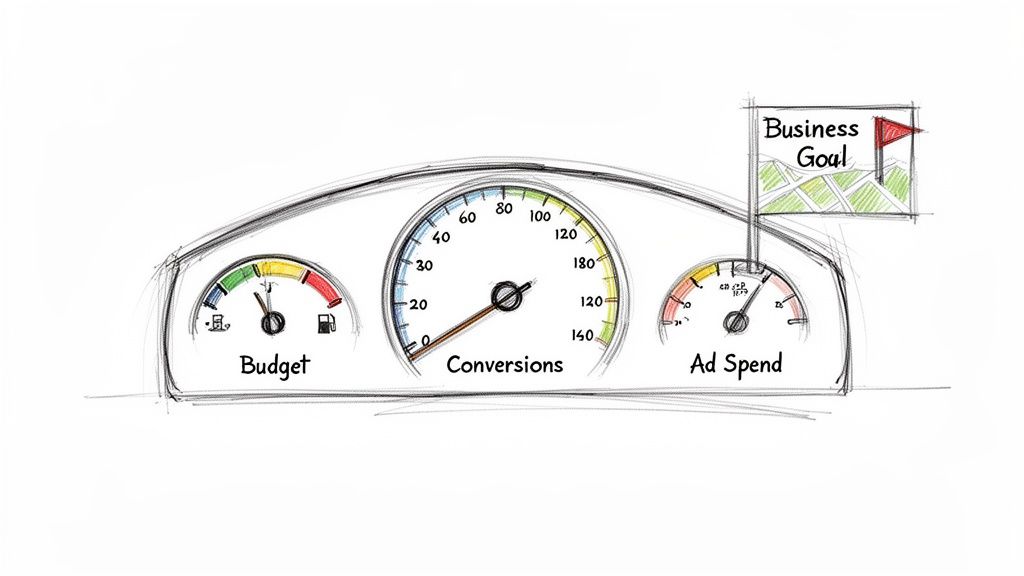
Think of your SEM campaign like a high-performance car on a cross-country road trip. Your destination is a business goal—maybe it’s more sales, or maybe it's a flood of new leads. Flying blind is, shall we say, a terrible idea. You need a dashboard.
That’s exactly what SEM reporting is. It’s the instrument panel that translates raw data into a compelling story, telling you everything you need to know about the journey. This isn't just a boring spreadsheet; it's your strategic guide.
Gauges on Your Dashboard
Glance at your car's dashboard and you immediately know your speed, fuel level, and distance traveled. An SEM report does the same for your marketing, just with different gauges:
- Ad Spend (The Odometer): This gauge shows how far you've come and what it cost to get here. It tracks every dollar, making sure you know the total cost of the trip so far.
- Conversions (The Speedometer): This tells you how fast you're moving toward your goal. High conversions mean you're flooring it. Low conversions mean it’s time to figure out what’s slowing you down.
- Budget (The Fuel Gauge): The most critical gauge of all. It shows how much fuel you have left to reach your destination. Running out of budget mid-campaign is like running out of gas in the middle of nowhere—a total disaster.
Without this dashboard, you're driving with a blindfold on, just hoping you end up somewhere profitable. That's why effective reporting is completely non-negotiable. It’s the difference between a successful road trip and a costly breakdown on the side of the highway.
An effective SEM report transforms you from a 'marketing expense' in the eyes of your boss into a 'revenue hero.' It’s proof that the investment is paying off, big time.
And that payoff can be huge. According to Google's own economic impact data, businesses generally make an average of $2 in revenue for every $1 they spend on Google Ads. A well-executed strategy can do even better, making any stakeholder sit up and take notice.
Properly tracking and presenting this data is what separates guessing from growing. To make this easier, tools like specialized Facebook advertising reporting software can help streamline data collection and report generation across different platforms. An organized approach to search engine marketing reporting is your secret weapon to proving incredible value.
Choosing the KPIs That Actually Matter
Diving into SEM reporting can feel like you're suddenly expected to read The Matrix. Green numbers and weird acronyms are flying everywhere, and it's easy to get lost in a sea of over 100 different metrics.
But here’s the secret: you don't need to track everything.
If your SEM report were a rock band, a handful of key performance indicators (KPIs) would be the headliners. The rest are just the opening acts—nice to have, but not what the crowd came for. Focusing on the essentials tells you 90% of the story and, more importantly, ties your efforts directly to business results.
The Headliners of Your SEM Report
So, which metrics absolutely have to be on your report? Think of it this way: you're running a coffee shop and spending money on flyers (your ads) to get people in the door to buy a latte (your conversion).
Let's look at the must-have metrics through that lens.
- Click-Through Rate (CTR): This tells you if your ads are grabbing attention. A high CTR is like a flyer with a "Free Coffee!" headline that makes people stop and look. A low CTR is a boring, text-only flyer that ends up in the trash. It's the first sign of whether your message is resonating.
- Cost Per Click (CPC): This is what you pay every time someone takes one of your flyers—or in this case, clicks your ad. Your goal is to keep this number as low as possible without sacrificing the quality of the people you're attracting.
- Cost Per Acquisition (CPA): This is the total cost to get one person to actually buy a latte. It's not just about getting them in the door; it's about what you paid to make a real sale happen. Executives love this metric because it connects ad spend directly to new customers.
- Return on Ad Spend (ROAS): This is the undisputed champion of SEM metrics. It answers the ultimate question: "For every dollar we spend on flyers, how many dollars are we making back in latte sales?" A ROAS of 4:1 means you're making $4 for every $1 you spend. If you can only report on one thing, make it this.
Choosing which KPIs to focus on can be tricky, but it's a critical step. If you'd like to dive deeper, you might be interested in how to choose KPIs for client reporting to ensure your reports are always on point.
To make this even clearer, here's a quick rundown of the most important SEM metrics and why they deserve a spot in every report you build.
Essential SEM Metrics At a Glance
| Metric (KPI) | What It Measures | Why It's a 'Must-Have' |
|---|---|---|
| Click-Through Rate (CTR) | The percentage of people who click your ad after seeing it. | Measures ad relevance and creative effectiveness. A low CTR signals a disconnect with your audience. |
| Cost Per Click (CPC) | The average amount you pay for each click on your ad. | Directly impacts your budget efficiency. Lowering CPC means your ad dollars go further. |
| Cost Per Acquisition (CPA) | The total cost to acquire one new customer or lead. | Connects ad spend directly to customer acquisition, showing the true cost of growth. |
| Return on Ad Spend (ROAS) | The amount of revenue generated for every dollar spent on ads. | The ultimate profitability metric. It answers the "Is this working?" question for stakeholders. |
| Impression Share | The percentage of impressions your ads received versus the total they could have received. | Reveals your market share and competitive pressure. A low number means you have room to grow. |
| Quality Score | Google's 1-10 rating of the quality and relevance of your ads, keywords, and landing pages. | A higher score leads to lower costs and better ad positions. It's Google's reward for good user experience. |
| Conversion Rate | The percentage of clicks that result in a desired action (like a purchase or sign-up). | Shows how effectively your landing page turns traffic into business. It's the bridge between clicks and revenue. |
These metrics work together to paint a complete picture of your SEM performance. While ROAS and CPA often steal the show, metrics like CTR and Quality Score are the diagnostics that help you understand why performance is strong or weak.
Beyond the Clicks: Conversion and Impression Metrics
While the "Big Four" KPIs are essential, a few others provide crucial context and help you understand the why behind your performance. Think of these as your band's talented supporting members—they make the headliners sound even better.
Impression Share
Think of impression share as your ad's slice of the market pie. It’s the percentage of times your ads were shown out of the total number of times they could have been shown. If your impression share is 30%, it means your competitors are showing up the other 70% of the time. This metric is fantastic for understanding competitive pressure and spotting opportunities to be more visible.
Quality Score
Google's Quality Score is like a report card for your ads, keywords, and landing pages. It measures relevance and user experience on a scale of 1-10. A higher score can lead to lower ad costs and better ad positions. Ignoring it is like showing up to an exam without studying—you'll probably pay the price.
A high Quality Score is Google’s way of rewarding you for creating a good experience for its users. Better ads at a lower cost? Yes, please.
Conversion Attribution
This one is a bit more complex but incredibly important. Attribution helps you understand which ads or keywords get credit for a conversion. Did the customer click three different ads over two weeks before buying? A good attribution model helps you see the whole journey, not just the final click that sealed the deal.
Ultimately, great SEM reporting isn’t about drowning stakeholders in data. It's about telling a clear, simple story with the right metrics that prove your campaigns are driving real business growth.
How to Build a Report That Actually Gets Read
There's a special kind of pain reserved for marketers who pour hours into building a report, only for it to vanish into the black hole of an executive's inbox. You pull the data, you make the charts, you check the numbers twice... and then, crickets. It's a soul-crushing experience.
So, what’s the secret to avoiding this digital graveyard? Stop making one-size-fits-all reports.
A report built for your CEO should look nothing like the one you send to your campaign manager. It's all about knowing your audience. You wouldn't use a sledgehammer to hang a family photo, so don't hit your boss with a 50-page data dump when all they need is the bottom line.
The Only Two Report Types You'll Ever Need
Let's break it down. You really only need to create two kinds of reports. Think of them as the "Just the facts, ma'am" version for the corner office and the "Let's get nerdy" deep dive for the folks in the trenches.
Tailoring your report makes your data more powerful and your insights impossible to ignore.
1. The High-Level Executive Summary (For the Boss)
Your CEO, CMO, or client stakeholder is busy. They operate on a different wavelength, and their primary concern is the big picture: results. They don't have the time—or frankly, the desire—to dig through keyword-level CPCs.
This report needs to be a quick, scannable snapshot of performance.
- Key Focus: Connect your SEM efforts directly to business goals. We're talking big-ticket items like Return on Ad Spend (ROAS), Cost Per Acquisition (CPA), and total conversions.
- Visuals: Keep it simple. Clean bar charts showing trends over time are perfect. A pie chart breaking down ad spend by campaign also works wonders.
- Language: Drop the jargon. Instead of saying, "Impression Share decreased by 12%," try framing it with business context: "Our main competitor is outbidding us on key search terms, which means they're getting more visibility."
This report should tell a compelling story in under five minutes. It’s all about proving value and justifying the budget.
A great executive summary instantly answers three questions: What did we spend? What did we get for it? And are we on the right track? Anything else is just noise.
2. The In-Depth Performance Review (For the Team)
Okay, this is where you can let your inner data geek fly. Your in-house team or the hands-on campaign manager needs all the gritty details to actually optimize performance. This report is their diagnostic tool, the thing they use to fine-tune the engine.
- Key Focus: Get granular. This is the place for metrics like Click-Through Rate (CTR), Cost Per Click (CPC), Quality Score, and conversion rates broken down by campaign, ad group, and even specific keywords.
- Visuals: Detailed tables and segmented charts are your best friend here. A table comparing the performance of different ad copy variations or a graph showing Quality Score trends can spark those "aha!" moments that lead to real improvements.
- Language: Technical terms are not only welcome, they're expected. Your team knows what "Impression Share lost due to rank" means and, more importantly, they know how to fix it.
This detailed review is the playbook for getting better, highlighting exactly where to make tweaks for bigger wins.
Finding Your Reporting Rhythm
Once you know what to report, you need to figure out when to report it. Nailing the delivery schedule, or cadence, is crucial. You want to keep everyone in the loop without drowning them in data. Send reports too often, and you risk "report blindness"—that's when people just start ignoring them altogether.
Here’s a simple guide to common reporting schedules:
| Cadence | Best For | Pros | Cons |
|---|---|---|---|
| Daily | High-spend, fast-moving campaigns (like a flash sale). | Allows for immediate reaction to performance spikes or nosedives. | Can easily lead to data overload and encourages knee-jerk, short-sighted decisions. |
| Weekly | The in-house team or campaign managers. | Provides enough data to spot meaningful trends and make tactical adjustments. | Might not show the full impact of longer-term strategic shifts. |
| Monthly | Executives and high-level stakeholders. | Perfect for showing strategic progress and the overall return on investment. | Not frequent enough for the day-to-day tweaks that drive campaign success. |
For most businesses, a hybrid approach is the sweet spot. A monthly executive summary keeps leadership happy and informed, while a weekly deep dive gives the marketing team the actionable data they need to hit their goals. This balanced approach ensures your search engine marketing reporting isn't just another email—it's a catalyst for action.
Connecting Your Data for the Full Story
Your search engine marketing data doesn't live in one big, happy home. It’s scattered across different platforms, and each one holds a crucial piece of the puzzle. Trying to make sense of your performance by looking at just one source is like trying to build a jigsaw puzzle with only the corner pieces—you’ll never see the big picture.
To tell the whole story, you need to bring all your data together. We call this data stitching, and it's how you connect the dots from that first ad click all the way to a final sale, proving your campaigns are actually worth the investment.
Think of each data source as a unique puzzle piece. By itself, it gives you a tiny glimpse. But when you snap them together, the entire customer journey comes into focus.
This flow chart shows how reporting needs to change depending on who's looking, from the 10,000-foot view a CEO needs to the nitty-gritty details the team lives in.
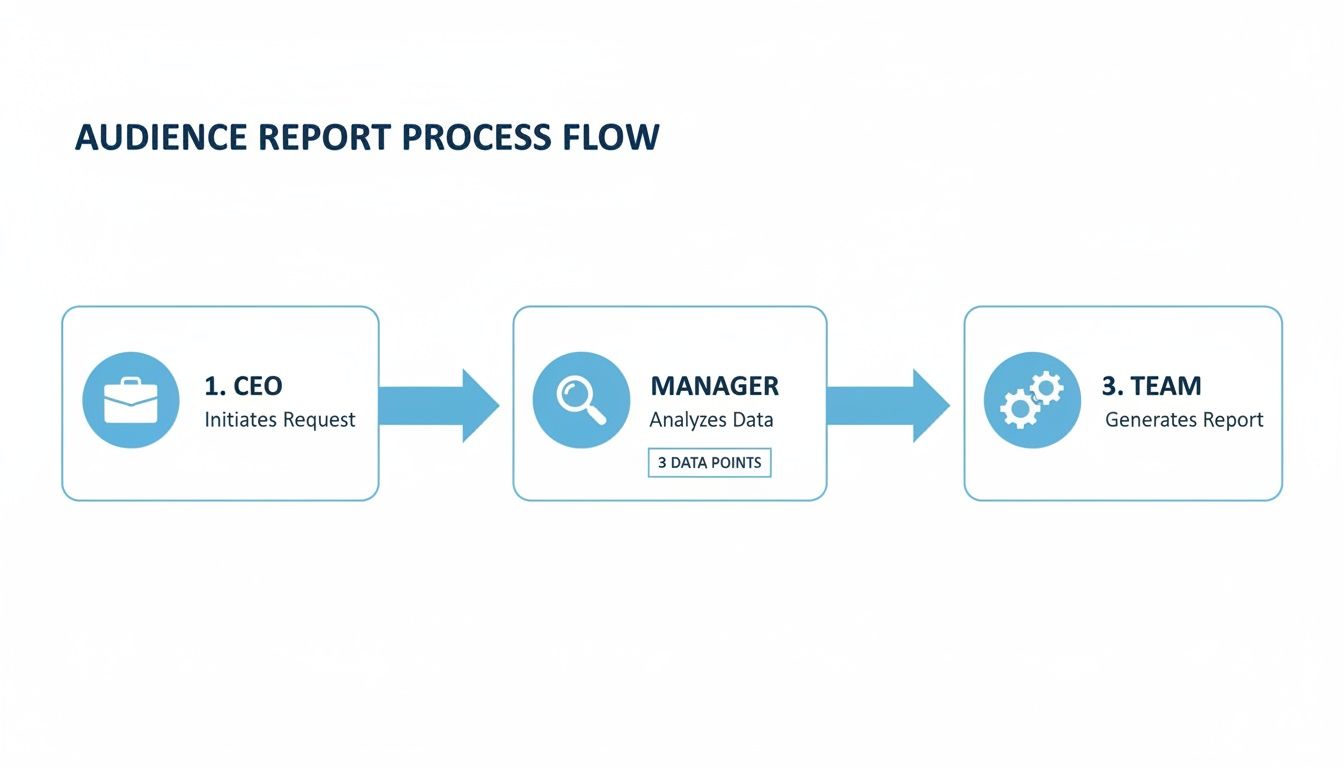
As you can see, when data flows correctly, high-level strategy, managerial oversight, and on-the-ground execution all stay aligned. It's about turning a mountain of data into clear, actionable insights for everyone involved.
The Essential Data Sources
To get that complete picture, you have to pull information from a few key places. Each one offers a different perspective, and when you combine them, you create a powerful, multi-dimensional view of your SEM efforts.
Here are the non-negotiable data sources you need to hook up for your SEM reporting.
Google Ads (The "What We Paid For" Piece): This is ground zero for your paid search campaigns. It tells you exactly what you're spending and what you're getting for it at the top of the funnel—metrics like clicks, impressions, CPC, and CTR. This is where the story begins.
Google Analytics 4 (The "What They Did Next" Piece): A click from an ad is great, but then what? Google Analytics 4 (GA4) picks up right where Google Ads leaves off. It tracks what people actually do on your site, showing you things like bounce rate, time on page, and conversion paths. It's the only way to know if those expensive clicks are turning into valuable engagement. For a deeper dive, check out this guide on PPC ROI tracking with Google Analytics to connect ad spend to actual results.
Google Search Console (The "Organic Sidekick" Piece): While we're focused on paid ads, you can't just ignore your organic performance. Google Search Console gives you a peek behind the curtain at how you're showing up in organic search. It reveals which queries are driving free traffic to your site, often uncovering some golden keyword opportunities for your paid campaigns.
CRM (The "Show Me the Money" Piece): This is the final and, frankly, most important piece of the puzzle. Your Customer Relationship Management (CRM) platform (think HubSpot or Salesforce) is where leads become actual, paying customers. By connecting your CRM data, you can tie a specific ad click not just to a form fill, but to $10,000 in closed-won revenue.
Stitching It All Together
Once you have your puzzle pieces, it's time to connect them. Data stitching is the technical term for linking a user's journey across these different platforms. It's how you can confidently say, "That click on the 'blue widgets' ad last Tuesday led to a website visit where the user downloaded a brochure, and yesterday they closed a deal worth $5,000."
Without data stitching, you're just reporting on isolated events. With it, you're telling a complete story about how your marketing efforts directly generate revenue.
This connected view is what elevates your SEM reporting from a simple expense summary to a powerful demonstration of ROI. You can prove that your ad spend isn't just a cost—it's an investment that drives real, measurable business growth. It stops the arguments, justifies your budget, and makes you look like a marketing genius. And who doesn't want that?
Avoiding Common SEM Reporting Mistakes
Welcome to the SEM reporting minefield. You've spent hours gathering your data, stitching it all together, and building what you think is the perfect report. But without a sharp eye for the usual slip-ups, all that hard work can go up in smoke the second a stakeholder asks the wrong question.
Think of this section as your friendly guide to sidestepping the classic blunders. It’s the “what not to do” chapter that saves you from those awkward, cringe-worthy moments in a meeting.
The Siren Song of Vanity Metrics
The most common trap? Getting obsessed with vanity metrics. These are the big, flashy numbers that look amazing on a slide but don’t actually tell you anything about the health of the business. We’re talking about impressions and, to a degree, clicks.
Sure, hitting a million impressions feels good. It’s like throwing a massive party where thousands of people show up. But if nobody buys anything, was it really a success?
Reporting on a huge number of impressions without tying it to conversions is like yelling, “Look how popular we are!” while your wallet is completely empty.
The cardinal sin of search engine marketing reporting is celebrating visibility over value. Always, always lead with metrics that tie directly to revenue, like ROAS and CPA. Everything else is just supporting evidence.
Forgetting to Check Your Tracking
Another classic mistake is trusting your conversion tracking blindly. Glitches happen way more often than you'd think, and they can completely torpedo your report's credibility. Imagine presenting a stellar month of sales, only to find out you were accidentally tracking form submissions from your own employees. Ouch.
This is a real problem, and it’s why quality assurance (QA) checks are absolutely non-negotiable.
- Filter Internal Traffic: Make sure you’re excluding IP addresses from your own office and any remote employees. Otherwise, your team’s daily website visits are going to inflate your traffic and conversion numbers.
- Test Your Forms: Every so often, submit a test lead through every single form connected to your campaigns. You need to be sure it shows up correctly in your analytics and CRM. A broken form means you're just paying for clicks that have no chance of converting.
- Audit Your Pixels: Use a browser extension to confirm your tracking pixels are firing correctly on key pages, like the thank-you page after a purchase. If the pixel doesn't fire, that conversion data is lost forever.
Ignoring Shifting User Behavior
Finally, don’t fall into the trap of assuming what worked last year will work this year. User behavior is constantly changing, and your reporting needs to reflect that reality. For instance, recent data shows a major shift in how people are using search engines, which creates new challenges for all of us.
According to one 2024 analysis, the number of Google searches per user in the US is projected to fall by nearly 20% between 2024 and 2025. This sharp decline is driven by AI-powered search providing more direct answers, meaning there are simply fewer opportunities for users to see and click on our ads.
As you build your reports, you have to contextualize performance against these broader market trends. You can find more insights on this from Search Engine Land's analysis of changing search trends. Ignoring this bigger picture could lead to unfairly judging a campaign’s performance in what is becoming an increasingly tough environment.
Using Automation to Save Time and Sanity
Are you still building your SEM reports in spreadsheets? The kind where you're copy-pasting data until your eyes glaze over? It’s time to join the 21st century and finally reclaim your Friday afternoons. Automation is here to save your time and, more importantly, your sanity.
This isn’t about being lazy; it’s about being smart. Modern reporting tools can automatically pull data from all your sources, populate beautiful templates, and email them straight to stakeholders, right on schedule. You can literally set it up once and let the robots do the grunt work while you sip your morning coffee.
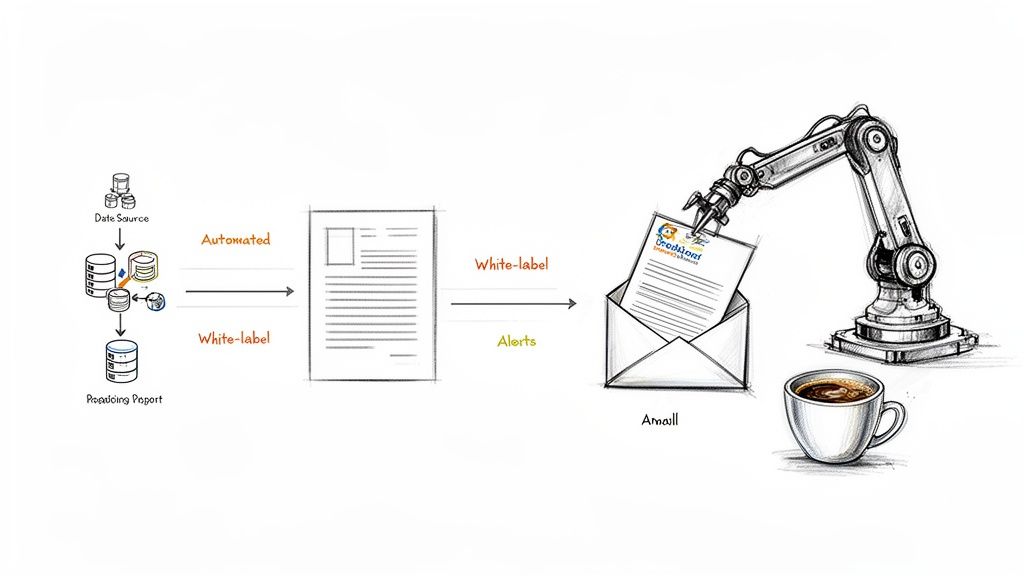
This process is like having a tireless assistant pulling data and delivering polished reports without you ever lifting a finger. The result is a consistent, professional reporting workflow that frees you up to focus on strategy instead of spreadsheets. If you want to really dial things in, leveraging AI automation tools can handle repetitive tasks and generate insights much more efficiently.
The Magic of White-Labeling for Agencies
For digital marketing agencies, automation has a special superpower: white-labeling. This feature is a total game-changer, letting you deliver professional, data-rich reports that look like they came straight from your in-house design team.
Instead of sending a generic report plastered with another company's logo, you can:
- Add your own branding: Upload your logo and brand colors to make every report a seamless extension of your agency.
- Customize templates: Build a unique report layout that highlights the metrics your clients actually care about.
- Schedule delivery: Set up automated monthly or weekly reports to go directly to your clients, so they always have the latest data.
This process builds client trust and reinforces your brand's value, all without the hours of manual labor. It's the ultimate "work smarter, not harder" solution for any agency managing multiple accounts. To see this in action, check out our guide on how to automate Google Analytics reports.
Catching Problems Before They Snowball
Automation isn’t just for sending out reports; it's also your first line of defense against campaign disasters. By setting up automated monitoring and alerts, you can spot data anomalies before they derail an entire campaign.
Think of automated alerts as a smoke detector for your data. You’d rather be alerted to a little smoke than find out your entire campaign has burned to the ground.
You can create alerts for sudden drops in traffic, spikes in CPA, or even if your conversion tracking pixel suddenly stops firing. These systems work 24/7 to spot trouble, sending you an instant notification via email or Slack the moment something looks off. This proactive approach to search engine marketing reporting means you’re always in control, fixing small issues before they become expensive problems.
Frequently Asked Questions About SEM Reporting
Okay, you've stuck with me this far. By now, you're practically a black belt in search engine marketing reporting. But let's be real, even the experts get stumped sometimes.
Let's run through a few of the common head-scratchers that always seem to pop up when you're deep in the data trenches. Think of this as the final review before the big exam.
How Often Should I Really Be Reporting?
This is the million-dollar question, isn't it? The most honest (and slightly annoying) answer is: it depends entirely on who’s getting the report.
- For your boss (the CEO or CMO): Monthly is the perfect rhythm. They need the 30,000-foot view of ROI and whether you're hitting major business goals. A daily play-by-play will just be noise.
- For your team (the campaign managers): Weekly hits the sweet spot. This gives them enough data to see real trends and make smart tweaks without overreacting to daily fluctuations.
- For yourself (the analyst in the trenches): Daily check-ins are fine for a quick pulse check. But whatever you do, don't make major decisions based on a single day of data. That's like judging an entire movie based on the opening credits.
Is SEO Part of SEM Reporting?
Yes, absolutely. Anyone who tells you otherwise is probably trying to sell you two separate services. Search Engine Marketing (SEM) is the big umbrella that covers both paid search (PPC) and organic search (SEO).
A truly complete search engine marketing reporting dashboard shows how these two work in tandem. Maybe a big PPC push for a new product drives brand awareness, leading to a 25% lift in branded organic searches a month down the line. You’d never connect those dots if you keep your reports in separate silos.
Neglecting SEO in your SEM report is like making a peanut butter sandwich without the jelly. Sure, it’s technically a sandwich, but you're missing half of what makes it great.
What Is a Good ROAS?
Ah, the classic "how long is a piece of string?" question. There is no single, magic number for Return on Ad Spend (ROAS). What's considered "good" is wildly different depending on your industry, profit margins, and specific business goals.
For an e-commerce store with healthy margins, a 4:1 ROAS (that's $4 back for every $1 spent) might be the baseline for success. But for a SaaS company with a huge customer lifetime value, a 2:1 ROAS could be fantastic, because that single conversion might lead to years of recurring revenue.
The key is to first define what profitability looks like for your business, and then work backward from there.
Stop drowning in spreadsheets and start making smarter decisions. MetricsWatch automates your reporting and alerts you to data issues before they become disasters. Try MetricsWatch for free and see how simple analytics can be.


