
Are you trying to build a Facebook Ads dashboard to better understand how your ads are performing?
Facebook is still the world’s most popular social media platform, with over 2.8 billion monthly active users.
As a result, it’s a great place to advertise. However, the market has become saturated over the years, so it’s important to give your business an edge over the competition.
But how do you do that?
By making data-driven decisions.
That’s why many marketers are using Facebook Ads dashboards to track the performance of their ad campaigns.
So today, we’ll explain what a Facebook Ads dashboard is and share with you some of the best KPIs to track when building your own.
We’ll also take a look at some of the pros and cons of using dashboards so that you can find the right solution for your reporting needs.
But first, let’s take a quick look at what a Facebook Ads dashboard is.
What Is a Facebook Ads Dashboard?
A Facebook Ads dashboard is a tool that lets marketers track key data from their Facebook pay-per-click (PPC) campaigns and display the results visually through graphs and charts.
By measuring results and KPIs over time, it provides insight into which ads are performing best - helping you identify opportunities to optimize your ads for a better return on investment.
But why choose to use a dashboard when you can view this data in Facebook Ads Manager?
Dashboards are designed to be easy to read and insightful. Facebook's Ads Manager, on the other hand, shows an excessive amount of data.
And while a lot of it can be useful, it isn’t necessary to view all your data all the time.
The most effective way to track progress towards your goals is to focus on just a few key metrics.
Once you have identified the best KPIs to track, your dashboard will make it easier to see what’s working and what isn’t. This way, you can allocate more of your budget to the ads that produce positive results.
Also, using a dashboard allows you to combine data from multiple sources to build more comprehensive reports.
For example, by combining your Facebook PPC and Google Analytics data, you can track how Facebook users behave on your website to better understand your audience. Doing this will let you optimize your Facebook campaigns further to address their specific pain points to increase your ads’ conversion rates.
The biggest benefits of using a Facebook Ads dashboard are:
- Better Understand Your Audience: When you see that a certain ad is driving the most traffic to your website, you can try to identify what is resonating with them (e.g. ad copy, design/artwork, call-to-action, branding, etc.) and create similar or better ads in the future.
- Measure Progress Towards Your Goals: Track how close or far your business is towards meeting its goals.
- Optimize Marketing Strategies: By making decisions based on data, you can create or improve strategies to generate more leads and increase revenue for your business.
Now that you have a better idea of what a Facebook Ads dashboard is and its benefits, let’s dive into 5 KPIs that you can include in your own dashboard.
5 KPIs for Facebook Ads Dashboards
First off, this is by no means an exhaustive list and you may discover other KPIs that best measure the success of your campaigns.
However, for those not sure where to start (and for those looking to shake things up) we’ll go through our 5 favorite KPIs for tracking ad performance and the benefits of including them in your Facebook Ads dashboard.
1) Cost Per Click
Cost per click lets you track how much you’re paying every time a user clicks on your Facebook ads.
This is important because it directly affects your budget and will determine how long a campaign can run.
By keeping track of this metric, you can clock when the cost gets too high so that you can either: stop that campaign or look for ways to optimize your ads and bring the cost down.
Many things can affect your CPC:
- The audience you’re targeting
- Your campaign goal
- When your ads are running
- Your ad’s quality ranking
- And more…
If you notice that your cost per click is too high, then you might want to consider split testing one or more of these factors to try and bring that cost down.
2) Click Through Rate (CTR)
Click through rate is shown as a percentage and represents how many users clicked your ad after being shown it.
This is a useful metric to track as it offers insight into the effectiveness of an ad campaign - a well-crafted ad will entice many users to click on it, whereas a bad one won’t.
By tracking your ad’s click through rate, you can start to identify correlations between your ad’s content and targeting, and how likely it is that people will click on it.
If your click through rate is low, you can try to increase it by experimenting with your:
- Ad copy
- Design & artwork
- Call to action
- Target audience
The average CTR of Facebook ads in 2022 varies greatly between industries - from 0.57% (Job & Employment) to 1.61% (Legal) - so be sure to measure yours against your company’s industry benchmark when assessing the performance of your campaign.
3) Conversions
Conversions track how many users performed your desired actions while on your website, such as online purchases, newsletter subscriptions, and free trial signups.
This metric is crucial to track on your Facebook Ads dashboard. If your ads are generating lots of website traffic but none of those users are converting, then those ads aren’t successful.
While you can track conversions natively in Facebook Ads Manager, we recommend tracking them inside Google Analytics for more accurate data. This way you can keep a high-level overview of your acquisitions while seeing your ROI of individual channels and campaigns.
However, to measure your conversions in GA as accurately as possible, you’ll need to optimize your tracking and campaigns by using UTMs.
UTMs allow a web analytics tool to properly segment the sources of your website traffic by campaign.
This way, you can see clearly how each Facebook campaign is helping you meet your overall business goals.
New to UTMs? You can learn more about What They Are And How To Use Them The Right Way in our ultimate UTM guide.
4) Amount Spent
Amount spent tracks the total cost of your Facebook ads campaign.
This one may seem obvious, but it’s important to include this metric in your dashboard to ensure that you:
a) Stay within your budget
b) Don’t spend all of your budget too fast
Your ad’s cost per click can change over time, so if you’re not paying attention to what your total spend is then your budget is at risk of disappearing sooner than you’d like.
To help control your budget, Facebook Ads Manager gives you options when building your campaigns, such as choosing between a lifetime or a daily budget.
5) Ad Frequency
Ad frequency is an average of how many times a user sees your ad.
Facebook is only able to estimate this metric, but it still has its benefits.
While repeatedly displaying an ad to a user can have value (especially in brand awareness campaigns), showing it too much to users over and over can end up having an adverse effect if you’re not careful.
For example, let's say your ad has been shown to users an average of 5 times and the click through rate is poor...
Well, if the goal of your campaign is to drive traffic to a website then this could suggest problems with either your targeting or with the design of the ad itself.
In cases like this, Facebook can view your ad as being irrelevant or ‘spammy’, resulting in a negative impact on the ad’s quality ranking (which in turn can raise its CPC and drain your budget).
By keeping track of your ad frequency rate, you can help avoid this.
If however, you keep finding yourself with high ad frequency and low CTR and conversions, you may want to pause your campaigns and revisit your overall strategy to address your targeting and ad design so as not to waste more of your budget.
Facebook Ads Dashboards vs. Reports: What’s the Difference?
Dashboards are great, and there are many benefits of using them to track your Facebook Ads KPIs.
But there’s also a chance that your business doesn’t need one.
Alternatively, you might benefit more from a Facebook Ads report.
While dashboards and reports are similar, there are some key differences between them. And understanding those differences can help you choose the right one for helping your business reach its goals faster.
Facebook Ads dashboards let you track your KPIs and display data visually, but they typically live and breathe on a 3rd party site through which marketers and clients can log in and view whenever they need to.
On the other hand, Facebook Ads reports have the advantage of being more flexible. Instead of requiring you to log in to view data, reports can be sent straight to the inbox of the recipient.
The main benefits of opting to send your data via reports are:
- Reports can be easily tailored for the person receiving it
- Recipients don’t need to remember to log into a 3rd party site to view their data and instead will be reminded via email (a tool they use every day already)
- It eliminates the need to manage user roles for clients, password resets, etc.
If you are going to spend the time organizing data for your team or clients, you want it to be as frictionless as possible when viewing that data.
And when it comes to creating automated reports, there’s no better tool than Metrics Watch:
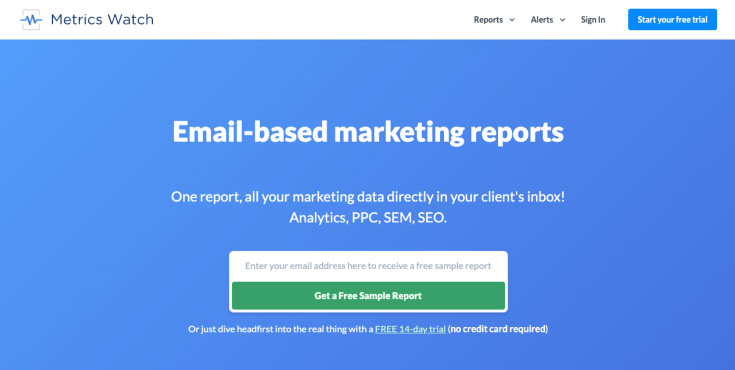
With Metrics Watch, you can create professional Facebook Ads reports fast.
Build custom reports from scratch with an easy-to-use drag & drop builder, or save time with one of our ready-made templates.
Combine data from multiple marketing channels to create comprehensive reports. Metrics Watch connects with:
- Facebook
- Instagram
- Google Analytics
- Google Ads
- Mailchimp
- And more…
Choose to schedule reports to be sent daily, weekly, or monthly with insights added automatically, so your team or clients know whether they’re on track to meeting their goals.
And the best thing about Metrics Watch?
Unlike other report builders out there that send reports as PDF attachments, your report is displayed in the body of the email itself, allowing recipients to view their data at any time, on any device.
This removes that unnecessary layer of friction that comes with using dashboards and increases the user experience.
Want to see it in action for yourself?
Try Metrics Watch for free with a 14-day trial - 100% risk-free, no credit card required.
Start building better reports today!
Start Your Free Trial Today!And that’s it for today. We hope this post has given you a better understanding of what a Facebook Ads dashboard is, as well as some inspiration for KPIs to get you started.
If you enjoyed this post, then be sure to check out these other articles:
These additional resources have even more tips and tricks that you can use to stay ahead of the competition and see better results from your Facebook Ads.