Your SEO Monthly Report Template to Finally Wow Clients

Here’s a free, downloadable SEO monthly report template that’s designed to save you hours of painful work. It’s built to turn a mountain of confusing data into a clear story that clients and stakeholders can actually get their heads around.
Why Your SEO Reports Deserve an Upgrade
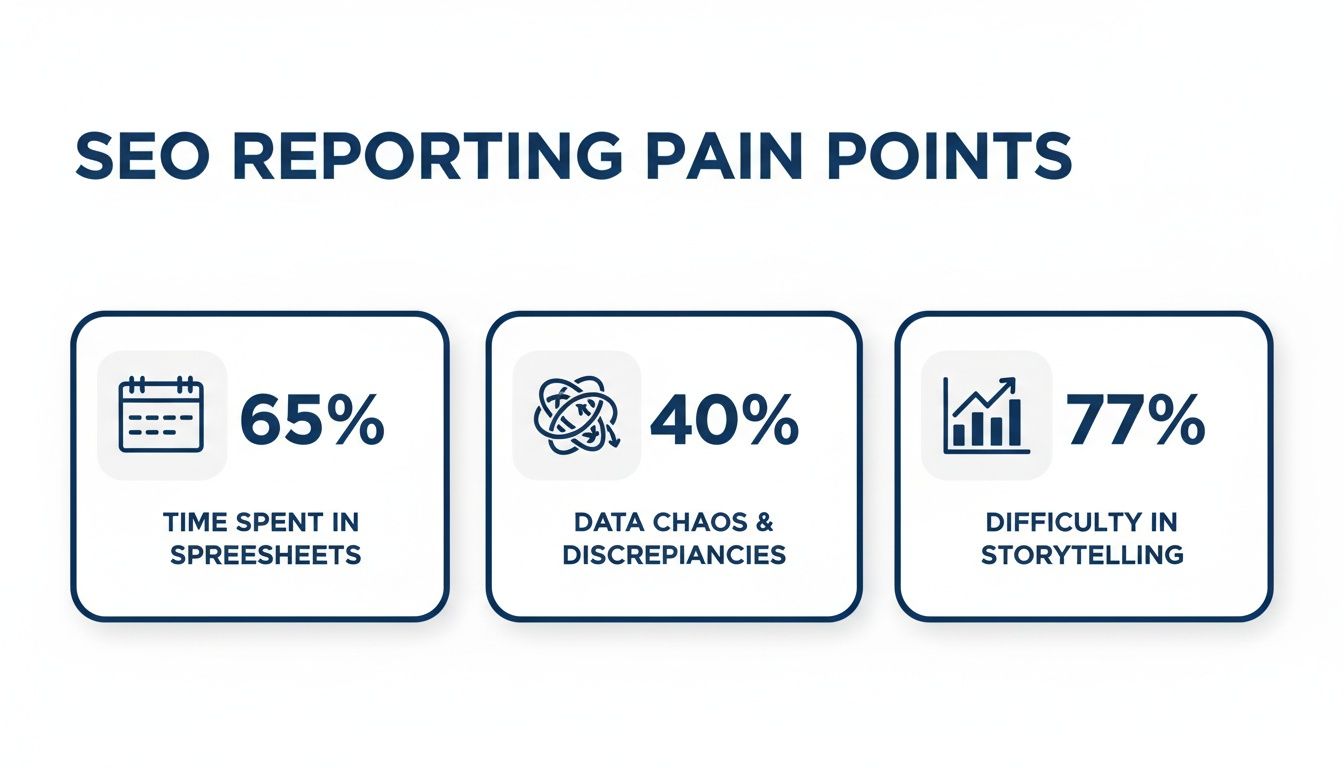
Let’s be honest for a second. Building SEO reports from scratch is a soul-crushing chore.
You spend hours wrestling with spreadsheets, pulling data from a dozen different tools, and trying to make it all look professional. It feels like you need a degree in data science just to explain what’s happening with a client's website.
Meanwhile, your client really only has one question: "Are we making more money?"
When a report is just a data dump, it creates more questions than answers. In fact, research shows a major complaint from clients is that reports are just too complex, making it impossible for them to see the real value you’re providing.
That’s why a solid SEO monthly report template isn't just a nice-to-have; it's your secret weapon.
It solves your biggest reporting headaches by:
- Saving Precious Time: Stop the manual copy-and-paste grind. An automated template can slash your reporting time by 40% or more, freeing you up for the actual strategy work that moves the needle.
- Creating Genuine Clarity: It organizes data into a logical narrative—what happened, why it happened, and what we're doing next.
- Demonstrating Your Real Value: It connects your SEO efforts directly to tangible business results, like traffic, leads, and cold hard revenue.
What Makes a Great SEO Report
A truly effective report isn't just about showing numbers; it's about telling a story of progress. This is what turns you from a simple data-puller into a strategic partner in your client's eyes.
Beyond just handing you a template, it’s crucial to understand how to structure your findings. If you want to dive deeper, you can learn more about crafting a better SEO monthly reporting format that actually helps drive growth.
The best reports focus on the "so what?" behind the data. If organic traffic went up 20%, the report needs to explain that this increase led to 50 new leads, directly tying your work to the client's bottom line. That's the difference between a report that gets filed away and one that gets celebrated.
Ultimately, a good template provides a consistent framework. This consistency helps clients quickly understand the information month after month, building trust and reinforcing the value of your partnership.
It’s about turning a dreaded task into a powerful communication tool that highlights your wins and keeps everyone aligned on the path forward. We'll show you exactly how.
Anatomy of an SEO Report That Gets Read
Here's a quick look at the essential parts that turn a data dump into a strategic conversation. Think of this as your cheat sheet for building reports that clients will actually look forward to.
| Report Section | What It Tells Your Client | Why You Absolutely Need It |
|---|---|---|
| Executive Summary | A quick, high-level snapshot of the month's performance and key wins. | It respects their time. Most execs will only read this, so make it count. |
| KPI Scorecard | How we're tracking against our most important goals (traffic, conversions, rankings). | Puts the most critical metrics front and center. No fluff, just the numbers that matter. |
| Organic Traffic Analysis | Where traffic came from, which pages are performing best, and new vs. returning users. | Shows growth and audience engagement. It's the core of what you do. |
| Keyword Rankings | Progress on target keywords, including movers and shakers. | Directly shows your impact on visibility for terms that drive business. |
| Backlink Profile | New links acquired and the overall health of the site's authority. | Proves you're building long-term authority and trust with search engines. |
| Action Plan & Next Steps | What we accomplished this month and what the plan is for the next 30 days. | This shows you're proactive and strategic, not just reactive. It keeps the project moving forward. |
Wrapping it all up, these sections work together to create a narrative. You start broad with the summary, dive into the specifics with KPIs and traffic, and finish with a clear, forward-looking plan. This structure keeps everyone on the same page and focused on results.
Choosing the KPIs That Actually Matter
So, you've got a shiny new template. That’s a great start. But the real magic happens when you fill it with data that doesn't immediately send your client into a deep sleep.
Just dumping every metric from Google Analytics into a report is a rookie mistake. It’s like trying to explain the plot of a movie by reading the entire script out loud—nobody wants that. Overwhelming clients with vanity metrics is the quickest way to get your hard work ignored.
Instead, your report should be a highlight reel, not the raw, unedited footage. We need to focus on Key Performance Indicators (KPIs) that tell a story about growth, engagement, and—most importantly—results. This is how you shift from being seen as a number-cruncher to the strategic partner you truly are.
The truth is, many SEOs get bogged down in spreadsheet hell or just struggle to turn a pile of data into a compelling narrative that a non-SEO can actually understand.
A solid template and the right KPIs cut through that chaos. Let's break down the metrics that build a story worth telling.
Visibility: How Easy Are You to Find?
This is all about top-of-funnel performance. Before anyone can click, buy, or subscribe, they have to be able to find you in the first place. Visibility KPIs answer one simple question: "Is our online footprint actually growing?"
- Organic Traffic: This is the big one. It’s the total number of people finding you through search engines, plain and simple. An upward trend here is the clearest signal your SEO efforts are paying off.
- Keyword Rankings: Tracking your position for target keywords shows direct progress. Don't just list a bunch of numbers. Highlight keywords that broke into the top 10 or jumped onto page one. This is tangible proof you're capturing valuable search real estate.
- Impressions: Pull this from Google Search Console. It shows how many times your site appeared in search results. While it's not traffic, growing impressions is a fantastic leading indicator of future traffic growth.
Engagement: What Happens When They Find You?
Okay, so people are landing on the site. Great! But are they sticking around, or are they hitting the back button faster than you can say "bounce rate"? Engagement metrics tell you if the content is actually connecting with the audience you're attracting.
A ton of traffic that doesn't engage is like a full restaurant where nobody orders any food. It looks busy, but it isn’t doing anything for the bottom line.
A common mistake is obsessing over traffic numbers alone. A 10% increase in traffic is meaningless if your conversion rate drops by 20% because you're attracting the wrong audience. Engagement KPIs provide the crucial context.
Here are the engagement metrics to keep an eye on:
- Average Engagement Rate: This GA4 metric shows the percentage of sessions where users were actively engaged (staying longer than 10 seconds, triggering a conversion, or viewing 2+ pages). A healthy rate here signals your content is hitting the mark.
- Top Performing Pages: Which pages are pulling in the most organic visitors? Highlighting these in your report not only shows what's working but also helps inform what you should do next.
- New vs. Returning Users: A healthy mix is what you want. New users mean your reach is expanding, while returning users show you're building an audience that trusts you.
Conversions: Are They Taking the Right Actions?
This is where the rubber really meets the road. Traffic and engagement are fantastic, but conversions are what pay the bills. These KPIs connect your SEO work directly to tangible business goals, making your value impossible to ignore.
As search engines incorporate more AI features, metrics from LLM visibility tracking agencies are quickly becoming another essential KPI to include in your reports to show the full picture.
Organic traffic growth might be the crown jewel of SEO reporting, but without the right templates, 62% of marketers admit they struggle to visualize this data effectively, according to a survey by HubSpot. This is precisely what a good monthly report solves by standardizing KPIs like month-over-month organic sessions and keyword ranking changes.
Here are the essential conversion metrics:
- Goal Completions (from Organic): Whether it's a contact form submission, a phone call, or a PDF download, this is the hard number of desired actions driven by your SEO work.
- Conversion Rate (from Organic): What percentage of your organic visitors are actually converting? This metric is all about the quality and efficiency of your traffic.
- Assisted Conversions: SEO often plays a crucial role early in the customer journey. This metric gives you credit by showing how many times organic search was a touchpoint in a conversion path, even if it wasn't the final click.
Turning Data Into a Compelling Story
Let’s be honest. A report packed with charts and graphs but zero explanation is just expensive wall art. It might look impressive, but it doesn't actually do anything for your client or your boss.
The real value—the stuff that gets you praise, proves your worth, and unlocks bigger budgets—comes from your analysis. This is where you graduate from being a data-puller to a strategic advisor. It’s all about crafting a punchy, clear story that a busy CEO can digest in thirty seconds flat.
Without that narrative layer, you’re basically handing your client a puzzle with all the pieces facing down. They hired you to put it together for them.
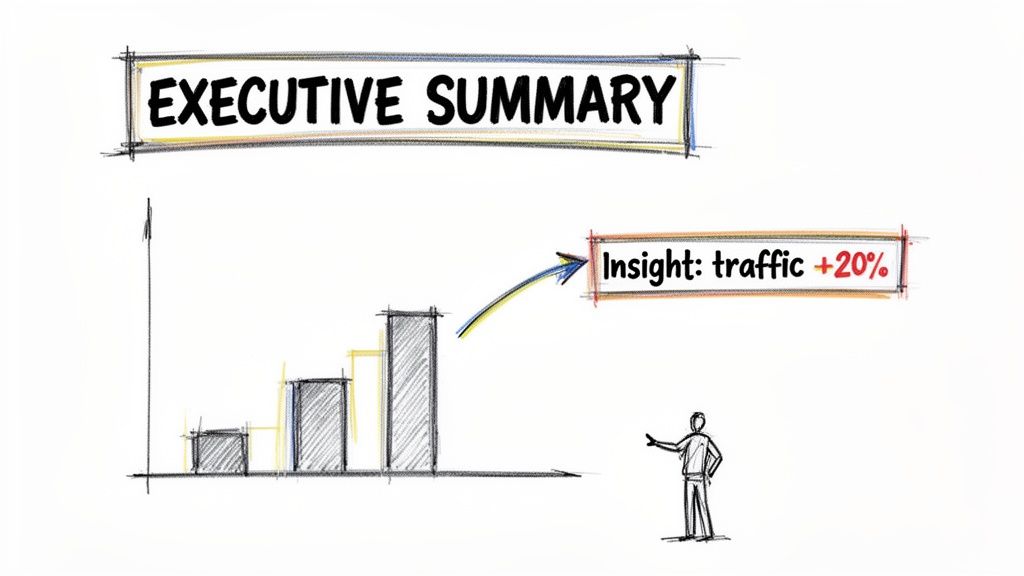
Start with a Killer Executive Summary
The executive summary is, without a doubt, the most important part of your SEO monthly report template. Why? Because for many stakeholders, it's the only part they'll read.
It needs to be short, sharp, and straight to the point.
Think of it as the movie trailer for your entire report. It should hit all the major plot points—the big wins, the key challenges, and what’s coming next—without getting bogged down in the boring details.
A great summary should answer three simple questions in less than a hundred words:
- What’s the big news? (e.g., "Organic traffic smashed our previous record, hitting 15,000 sessions this month.")
- Why should they care? (e.g., "This surge was driven by our new content strategy, which brought in 75 new qualified leads.")
- What's our next move? (e.g., "Next, we're targeting long-tail keywords in this topic cluster to capture more high-intent traffic.")
This is how you prove your ROI instantly. If you can't articulate your value in a few sentences, don't expect your client to see it either.
Add Commentary That Connects the Dots
After the summary, your real job begins: adding insightful commentary to each section of the report. This is your chance to explain the "why" behind the numbers. Don't just show a chart of keyword rankings going up; tell them what you did to make that happen.
For instance, never just say, "Keyword 'blue widgets' went from position #12 to #4."
Instead, tell the whole story: "Our targeted link-building campaign and on-page optimizations for the 'blue widgets' category page successfully pushed its keyword ranking from #12 to #4. The immediate result was a 40% jump in clicks for one of our highest-converting terms."
See the difference? One is a bland fact. The other is a victory lap that justifies your fee.
If you really want to make your charts and graphs pop, check out our guide on the best practices in data visualization for marketing reports. It’s full of tips to make your points even clearer.
A common mistake I see is people just describing the data. "Traffic went up" is not an insight. An insight is, "Traffic went up because the new blog series we launched resonated with our target audience on LinkedIn, proving our new content-market fit."
This kind of commentary is absolutely essential. It also helps you manage expectations. If there's a dip in traffic, you can proactively explain it—maybe it was a pesky Google algorithm update or just a seasonal trend—and outline your plan to address it. Transparency builds trust faster than anything else.
From Boring Data to Brilliant Insights
See how a few lines of thoughtful commentary can turn a dry metric into a powerful success story.
| The Metric | The Boring Way (Don't Do This) | The Storytelling Way (Do This!) |
|---|---|---|
| Organic Traffic | Organic sessions increased by 20% month-over-month. | Our new blog series on "DIY Home Improvement" drove a 20% traffic spike, directly leading to 50 new trial sign-ups for our design software. |
| Backlinks | We acquired 15 new backlinks. | We landed 15 high-authority backlinks, including a feature in a major industry publication, which boosted our domain authority by 2 points. |
| Conversion Rate | The organic conversion rate was 2.5%. | We optimized the checkout page based on user feedback, increasing the organic conversion rate from 2.1% to 2.5% and generating an extra $5,000 in revenue this month. |
The goal of your SEO monthly report template is to make your client feel smart and confident in their investment. You do that by translating raw data into clear business outcomes they actually care about.
This narrative approach isn't just nice to have; it's crucial for keeping clients happy and demonstrating your undeniable value.
Let's be real for a second. Handing the exact same report to your agency’s point-of-contact and their CEO is like trying to serve a five-course gourmet meal to a toddler. The toddler just wants the mac and cheese, and the CEO just wants the highlights.
A 'one-size-fits-all' report is really a 'one-size-fits-none' disaster waiting to happen. The metrics an e-commerce manager obsesses over are completely different from what a SaaS product lead needs to see. Tailoring your SEO monthly report template for the person reading it is non-negotiable.
It’s the simple difference between your report being a powerful tool and an unread PDF lost in a cluttered inbox. Showing you get what your audience actually cares about makes your reports infinitely more impactful.
Brand It and Make It Yours
Before we even get into the data, let's talk aesthetics. If you’re an agency, your report is a direct reflection of your brand. A generic, unbranded report screams, "We don't pay attention to the details."
Think of your template as a canvas for your brand identity.
- Add Your Logo: This is the bare minimum. Place it right at the top so there's no question who delivered these awesome results.
- Use Your Brand Colors: Swap out the default blues and grays for your company's color palette. It makes the report feel custom-built and professional.
- Include Your Contact Info: Make it easy for them to reach out with questions or, even better, to praise your incredible work.
This isn’t just about looking pretty. Consistent branding reinforces your agency's professionalism and builds a stronger client partnership. It turns a simple data document into a piece of your brand collateral.
Reporting for E-Commerce Clients
When you're working with an e-commerce business, the conversation should always circle back to one thing: sales. They don't just want traffic; they want transactions. Your report needs to speak the language of online retail.
An e-commerce manager doesn't care about a 2% increase in domain authority. They care about a 2% increase in the add-to-cart conversion rate that generated an extra $10,000 in revenue last month.
Your e-commerce SEO report template absolutely must spotlight the metrics that directly impact their bottom line.
Focus on these KPIs:
- Organic Revenue: This is the most important metric, period. Show them the money you're generating through search.
- Organic Conversion Rate: Are the visitors you're bringing in actually buying things? This metric proves the quality of your traffic.
- Top Performing Product & Category Pages: Highlight which pages are driving the most organic traffic and revenue. This helps them understand which products are winning at SEO and can inform their inventory and marketing decisions.
- Average Order Value (AOV) from Organic: Are organic customers spending more or less than customers from other channels? This adds another layer of value to your SEO efforts.
Reporting for B2B and SaaS Clients
For B2B or SaaS companies, the game is different. The sales cycle is longer, and the immediate goal isn't always a direct purchase. It's about generating qualified leads and nurturing them through the funnel. Your report needs to reflect this journey.
These clients are way less interested in broad traffic numbers and more focused on lead quality. A thousand unqualified visitors are useless, but five high-quality demo requests could be a massive win.
Your B2B/SaaS report should emphasize:
- Lead Generation from Organic: Track contact form submissions, demo requests, and whitepaper downloads. This is their equivalent of revenue.
- Lead Quality: If possible, work with their sales team to understand which organic leads turned into Sales Qualified Leads (SQLs). Showing you're driving leads that actually close deals is the ultimate proof of value.
- Keyword Rankings for High-Intent Terms: Focus on rankings for "bottom-of-funnel" keywords like "[your service] pricing" or "best [your product] alternative." These are the terms that attract users ready to make a decision.
- Assisted Conversions: SEO often plays a vital role at the start of a long customer journey. Use assisted conversion data from a tool like Google Analytics to show how organic search influenced leads that eventually converted through other channels.
By customizing your SEO monthly report template for each audience, you stop being a vendor who just sends data and become a strategic partner who delivers insights.
Putting Your SEO Reporting on Autopilot
Manually building reports month after month is a one-way ticket to burnout city. Population: you.
If you've ever found yourself staring at a spreadsheet at 10 PM on the last day of the month, wondering if this is what you really went to school for, it’s time to work smarter, not harder.
Let’s talk about automation. No, it’s not about being lazy; it's about being strategic and scalable. It's about freeing up your brainpower from the copy-paste grind so you can focus on high-impact work—you know, the actual SEO that gets results.
Imagine your clients getting a professional, insightful, and beautifully branded report delivered to their inbox like clockwork, without you lifting a finger. That's not a fantasy. It's what happens when you let the robots take over the boring stuff.
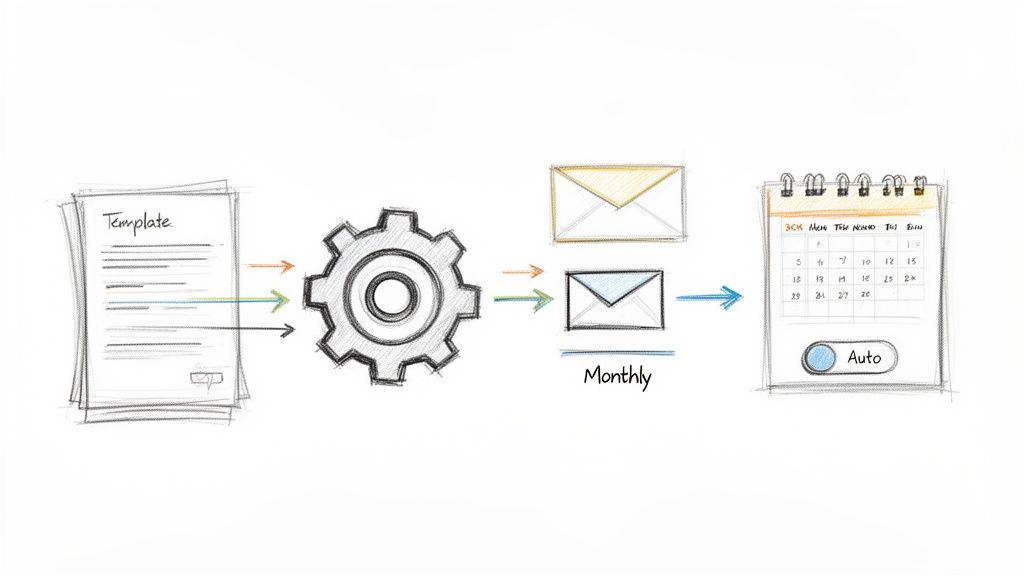
This workflow shows exactly how an automated system can pull data, populate your template, and schedule deliveries. It turns a multi-hour chore into a set-it-and-forget-it process. The best part? That kind of consistency builds incredible trust with clients.
How Automated Reporting Works
So how do you actually put your reporting on autopilot? It all starts by using a tool that can connect directly to your data sources. Think of it as giving a very smart assistant the keys to your analytics accounts.
Tools like MetricsWatch are designed specifically for this. You hook them up to your Google Analytics, Google Search Console, and other marketing platforms. Then, you choose a template (or build your own branded one) and tell the system which KPIs you want to feature.
The process generally looks something like this:
- Connect Your Data Sources: First, you grant secure access to platforms like GA4, Search Console, Google Ads, and social media accounts. This is the "pulling" part of the process.
- Build Your Report Template: This is where you set up your SEO monthly report template with your agency's branding, choose the charts and graphs you want, and decide on the layout. You only have to do this once.
- Schedule the Delivery: Finally, you set the frequency (daily, weekly, or monthly) and the delivery time. You can even create different reports for different stakeholders and send them all out automatically on different schedules.
Once it's set up, the system handles the rest. On the first of the month, it automatically pulls the previous month's data, populates your template, and emails a clean, professional report directly to your client. You can sip your coffee while your reporting gets done for you.
The real win here isn't just the time saved, although that’s huge. It’s the scalability. You can onboard five new clients without adding five more days of reporting work to your plate. Automation is how you grow an agency without losing your mind.
The Strategic Edge of Automation
Automating your SEO reports isn't just about efficiency; it gives you a serious strategic advantage. The time you save on manual data entry can be reinvested into deeper analysis and strategy.
Instead of spending hours just building the report, you can spend that time analyzing the automatically generated data to find the golden nuggets of insight for your client.
The impact of this shift is massive. Research from the Digital Marketing Institute found that marketing teams can save up to 40% of their time by automating repetitive tasks, letting managers focus on high-cost issues instead of spreadsheet formatting. This extra time is where your true value lies.
You can:
- Spot Trends Earlier: With reports generated automatically, you can spend your time looking at the bigger picture and identifying trends your competitors might miss.
- Provide Deeper Insights: You have the bandwidth to dig into the "why" behind the numbers, providing the kind of commentary that clients truly value.
- Focus on Proactive Strategy: Instead of just reporting on what happened last month, you can use your time to build a more robust plan for the month ahead.
Automating your reporting process transforms it from a dreaded administrative task into a powerful strategic tool. If you want to dive deeper into how this works, explore these ways to automate client marketing reports. It's the key to scaling your services, delighting your clients, and finally getting your weekends back.
Got Questions About SEO Reporting? We’ve Got Answers.
Let's be real, even with the slickest SEO monthly report template, questions are going to pop up. Clients get curious, bosses want details, and sometimes you just need to get ahead of expectations before they spiral.
Having solid, straightforward answers ready not only cements you as the expert but also builds a massive amount of trust. So, let's dive into some of the burning questions that always seem to surface.
How Often Should I Send an SEO Report?
Monthly. That's the gold standard, and for good reason. It’s the sweet spot.
Sending a report every month is frequent enough to show real momentum and make smart tweaks to your strategy. But it’s not so frequent that you’re just reporting on tiny, meaningless daily blips in traffic that send everyone into a panic for no reason.
A monthly report lets you tell a coherent story of what happened over the last 30 days. You can analyze actual trends and line up your efforts with your client's business planning cycles. It’s the perfect cadence to prove your value without creating a bunch of noise.
What’s the Difference Between a Report and a Dashboard?
This one trips people up all the time. I like to think of it like this: a dashboard is your car's speedometer—a live, real-time feed of data. It’s fantastic for you, the SEO pro, to keep an eye on daily performance and spot issues the second they happen.
A report, on the other hand, is the travel log of your journey. It’s a static snapshot in time that tells a story.
A dashboard shows you what happened. A report explains the why and the what's next. Your client almost always needs the story, not a firehose of raw data. They hired you for your brain, your analysis, and your strategic guidance.
So while a dashboard just spits out numbers, a report connects those numbers directly to business goals, adding that crucial layer of context and a clear plan of action.
How Do I Report on Bad News or Slow Months?
You own it. Right away, and without any excuses.
Trying to spin or, worse, hide bad news is the quickest way to torch a client relationship. It’s a surefire way to turn a small problem into a five-alarm fire. Instead, you need to tackle the dip head-on.
Here’s a simple, three-part framework that has never failed me:
- State the Facts: "As you'll see in the data, organic traffic was down 15% this month." Just be direct and transparent.
- Present Your Hypothesis: "My analysis points to two main factors: the recent Google core update, which hit our industry hard, combined with a seasonal dip we typically see this time of year." Use data to back up your explanation.
- Outline Your Action Plan: "To counter this, we're launching a new content cluster targeting long-tail keywords less affected by the update and will be re-optimizing our top 10 pages. I expect to see the numbers stabilize within the next 30-45 days."
Framing a downturn as a challenge you're already solving shows expertise and control. It proves you're a strategic partner, not just a vendor who vanishes when the going gets tough. In fact, a 2023 study found that teams using a structured reporting approach see 30% higher client retention, mostly because it makes communicating both wins and challenges so much more effective.
What Tools Are Best for Creating SEO Reports?
You've got a few paths you can take here, and the best one really boils down to your budget and how much you value your time.
- The DIY Route (Google Sheets & Slides): This is the "free" option. You get total control and flexibility, but it’s a massive time sink. You’ll spend hours every month just copying and pasting data—time you should be spending on actual strategy.
- Data Viz Tools (Looker Studio): Tools like Looker Studio (formerly Google Data Studio) can create some beautiful, interactive dashboards. They’re a huge step up from spreadsheets, but they have a steep learning curve and often lack the storytelling context that a client really needs.
- Automated Reporting Platforms (MetricsWatch): For the best of both worlds, platforms like MetricsWatch automate the whole shebang. They pull data from all your sources, drop it into your branded SEO monthly report template, and email it out on a schedule.
This isn't about cutting corners; it's about being smart with your resources. According to a report by MarketingProfs, marketers spend an average of four hours per week on reporting alone. An automated tool can slice the data-pulling part down to zero, letting you pour all that time into the high-value analysis clients actually pay you for.
Ready to stop wrestling with spreadsheets and put your reporting on autopilot? With MetricsWatch, you can create stunning, white-labeled reports that are automatically delivered right to your clients' inboxes. Start your free trial today and see just how much time you can get back.


