The Sales Growth Rate Formula: Your Business's Not-So-Secret Speedometer

Tired of trying to prove your marketing genius with fluffy slide decks that make your clients' eyes glaze over? The sales growth rate formula is the cold, hard number that tells you—and them—if your brilliant strategies are actually, you know, working.
Think of it as the speedometer for your sales engine. It shows you exactly how fast you're picking up speed, or if you're about to stall out.
Article Highlights (The TL;DR Version)
No time for the nitty-gritty? Here’s the cheat sheet.
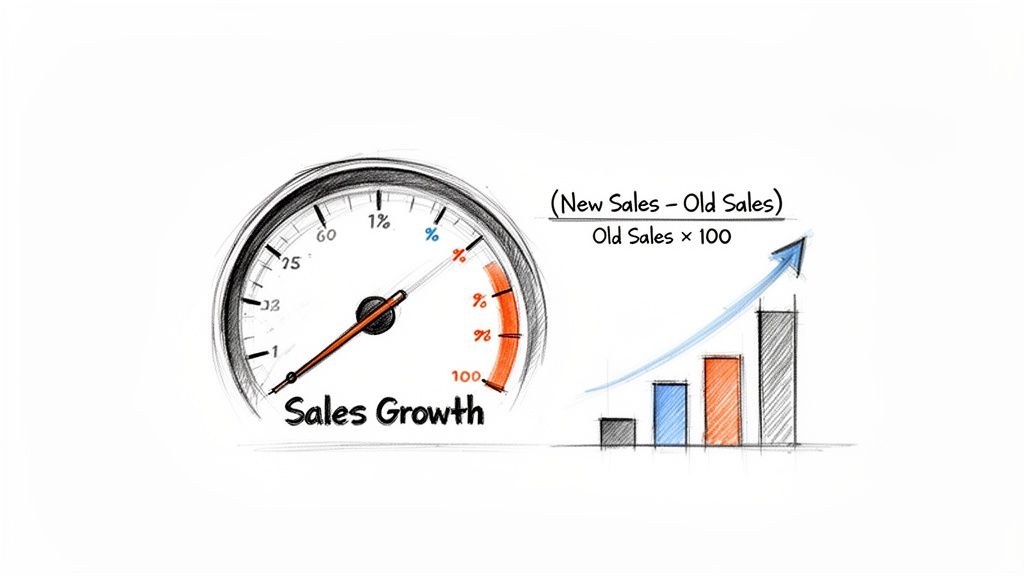
- The Magic Formula: The sales growth rate formula is simply:
((Current Sales - Previous Sales) / Previous Sales) x 100. It’s the percentage change between two periods. Easy peasy. - Why It's a Big Deal: This isn't a vanity metric. It's the ultimate proof that your marketing is moving the needle on what really matters: revenue. A positive number means you're growing; a negative one means it's time for a "we need to talk" meeting.
- Context is King: A "good" growth rate depends entirely on your industry, company size, and goals. A startup's 100% growth and a Fortune 500's 5% growth can both be cause for celebration.
- Beyond the Snapshot (CAGR): For a long-term view that smooths out the crazy ups and downs, use the Compound Annual Growth Rate (CAGR). It’s the number investors actually care about because it shows sustainable growth.
- Avoid the Traps: Don't get fooled by your own numbers. Always compare year-over-year to account for seasonality, ignore one-off viral spikes, and use consistent time periods for your calculations.
Why Sales Growth Is Your Ultimate Truth Teller
Let's be real, vanity metrics are fun, but they don't pay the bills. Clicks, likes, and shares are great for a little ego boost, but the C-suite and your clients want to see one thing above all else: sweet, sweet revenue growth.
The sales growth rate is a simple percentage that cuts through the noise. It tells a powerful story about a company's health and the real impact of your marketing wizardry.
It’s the ultimate proof that what you’re doing is making the cash register sing. This single metric helps you justify budgets, prove your value, and make smarter strategic decisions by answering the big question: "Are we selling more today than we were yesterday?"
What Is the Sales Growth Rate Formula? (Don't Worry, It's Easy)
At its core, the sales growth rate formula is refreshingly simple. No complex calculus or summoning ancient spirits needed here, just a bit of basic arithmetic that reveals a ton about performance.
The sales growth rate formula is: ((Current Period Sales - Previous Period Sales) / Previous Period Sales) × 100.
This calculation gives you a percentage showing how much your sales have increased or (gulp) decreased between two periods. It’s the go-to metric for measuring momentum. If the number is positive, you’re growing. If it’s negative, it’s time to brew a strong pot of coffee and figure out why.
Growth in the Real World
This formula isn't just for internal reports; it paints a picture of entire industries. Take the global retail market, for example. According to Statista, worldwide retail e-commerce sales are projected to grow by 39% between 2023 and 2027. Traditional retail? Not so much. That single stat, derived from this simple formula, shows you exactly where the party's at.
Tracking this metric is fundamental to demonstrating value. For digital marketing agencies juggling multiple client accounts, it's the quickest way to gauge if campaigns are driving real results. And if you're serious about proving your impact, you might also want to explore our guide on how to build a campaign ROI calculator.
The Quick Guide to Sales Growth
Don't have time to read a textbook on sales metrics? I get it. You've got things to do. Here's the "just tell me what I need to know" version.
Think of sales growth as the pulse of your business. It’s a dead-simple KPI that tells you if your revenue is climbing, stalling, or taking a nosedive. A healthy, positive growth rate is a powerful signal to investors, your team, and even yourself that you’re headed in the right direction. It's a fact: companies that keep a close eye on their growth are just plain better at rolling with the punches when the market gets weird.
Core Concepts You Need to Know
Let's cut to the chase. Here are the essential takeaways for the sales growth rate formula:
- The Basic Formula: At its heart, the formula is just ((Current Sales - Previous Sales) / Previous Sales) x 100. This gives you the percentage change between two time periods, like this quarter versus last quarter.
- What It's Telling You: Got a positive number? Congrats, you're a rockstar and your sales are growing! A negative number means they've shrunk, and it’s probably time to figure out what went wrong.
- Why It Matters: This is the ultimate gut check for your business momentum. It helps you see if your marketing campaigns, product launches, and big-picture strategy are actually working.
To really kickstart your sales and build something that lasts, you've got to nail down how to find your target market first. Seriously, knowing exactly who you're selling to is the bedrock of any solid growth plan.
Looking Beyond the Snapshot
The basic formula is fantastic for a quick look, but sometimes you need a wider view. A huge sales spike one month is awesome, but can you keep it up? That’s the real question.
This is where its more sophisticated cousin, the Compound Annual Growth Rate (CAGR), struts onto the scene. Instead of just looking at one period to the next, CAGR smooths out all the crazy ups and downs over several years to give you a single, steady average growth rate. This is the number investors drool over because it points to long-term health and predictability.
We’ll dig into CAGR later on. For now, just know you’ve got tools for both the short-term sprints and the long-term marathon.
Calculating Sales Growth Without the Headache
Alright, let’s get down to business. Forget any math class nightmares you might be having—the sales growth rate formula is one you'll actually want to remember. It's simple, powerful, and proves your marketing efforts are more than just pretty pictures.
We're going to walk through it step-by-step. No weird jargon, just a clear path to getting a number that screams "we're winning" to your clients.
The Simple Sales Growth Formula
The formula itself is refreshingly straightforward. All you need are two numbers: your sales from a previous period (like last quarter) and your sales from the current period (this quarter).
((Current Period Sales - Previous Period Sales) / Previous Period Sales) x 100
That’s it. This calculation gives you a clean percentage that shows how much your sales have changed. Let's see it in action.
A Real-World Example You Can Steal
Imagine you're managing marketing for a cool, fictional e-commerce store called "Cosmic Threads," which sells quirky space-themed t-shirts. You need to show the owner that your latest campaign was a smashing success.
Here's the data:
- Previous Period Sales (Q1): $50,000
- Current Period Sales (Q2): $70,000
Now, let's plug those numbers into our formula:
- Find the difference: $70,000 (Current) - $50,000 (Previous) = $20,000
- Divide by the previous period's sales: $20,000 / $50,000 = 0.4
- Multiply by 100 to get the percentage: 0.4 x 100 = 40%
Boom! Cosmic Threads had a 40% sales growth rate in Q2. That's a number you can proudly put in any report. It's a clear, undeniable sign that things are moving in the right direction. For most businesses, a consistent, positive growth rate is the single most important indicator of health.
Of course, true growth isn't just about revenue; it's also about customer health. To get a more complete picture, it helps to understand the essential customer success metrics and formulas that look at things like revenue, product usage, and customer sentiment.
Copy-and-Paste Formulas for Your Tools
Calculating this by hand is easy, but who has the time? Most of us live in spreadsheets and databases, so here are some ready-to-use formulas to make your life even easier.
Let's assume your previous sales figure is in cell A1 and your current sales figure is in cell B1.
Sales Growth Rate Formula Cheatsheet
| Tool | Formula or Query | Best For |
|---|---|---|
| Google Sheets | =(B1-A1)/A1 |
Collaborative teams who need real-time, shareable sales tracking without the fuss. |
| Microsoft Excel | =(B1-A1)/A1 |
Data pros and finance teams who live in complex spreadsheets and need robust functionality. |
| Basic SQL | SELECT ((current_sales - previous_sales) / previous_sales) * 100 AS growth_rate FROM your_sales_table; |
Developers and data analysts who need to pull growth metrics directly from a live database. |
These simple snippets can save you a ton of time, especially when you're managing multiple clients or campaigns.
Instead of crunching numbers manually, you can build a dynamic dashboard or report that updates automatically. Automating this calculation is a key step in building an efficient marketing KPI tracker that gives you insights without the manual labor.
After all, research from Salesforce shows that sales reps spend a shocking 72% of their day on non-selling tasks. Automating calculations like this frees you up to focus on what actually drives that growth in the first place—strategy and execution.
Moving From Simple Percentages to Long-Term Vision With CAGR
Seeing your quarter-over-quarter growth is a fantastic feeling. A 40% spike feels like you've hit the jackpot, and you should absolutely celebrate it. But what happens when the next quarter is flat, or even dips a little?
That single percentage point is just a snapshot, a polaroid from one moment in time. To get the real story behind your business's trajectory, you need to zoom out and watch the whole movie. This is exactly where the Compound Annual Growth Rate (CAGR) comes in.
Think of CAGR as your "smoothed out" growth rate. It irons out all those wild, volatile ups and downs you see in monthly or quarterly numbers. The result is a single, steady average that tells you how you're really performing over the long haul. It's the metric investors and strategic planners live by because it points to sustainability, not just a one-time win.
Why CAGR Is Your Crystal Ball for Growth
So, why bother with another formula? Because CAGR answers a much more powerful question: "If our growth were perfectly steady over the last few years, what would that consistent annual rate be?"
Looking at your business this way is crucial for a few big reasons:
- It tempers volatility: It smooths over the numbers from that one-off viral campaign or that unexpectedly slow season, giving you a more realistic picture of your true momentum.
- It enables better forecasting: When you understand your steady, long-term growth rate, you can make far more reliable projections about future revenue.
- It’s the language of investors: When you're talking about the long-term health of a business, CAGR is the gold standard. It’s proof of stability and predictable growth.
This visual shows that simple quarter-over-quarter growth we've been talking about, which is the foundational data point you need for more complex analyses like CAGR.
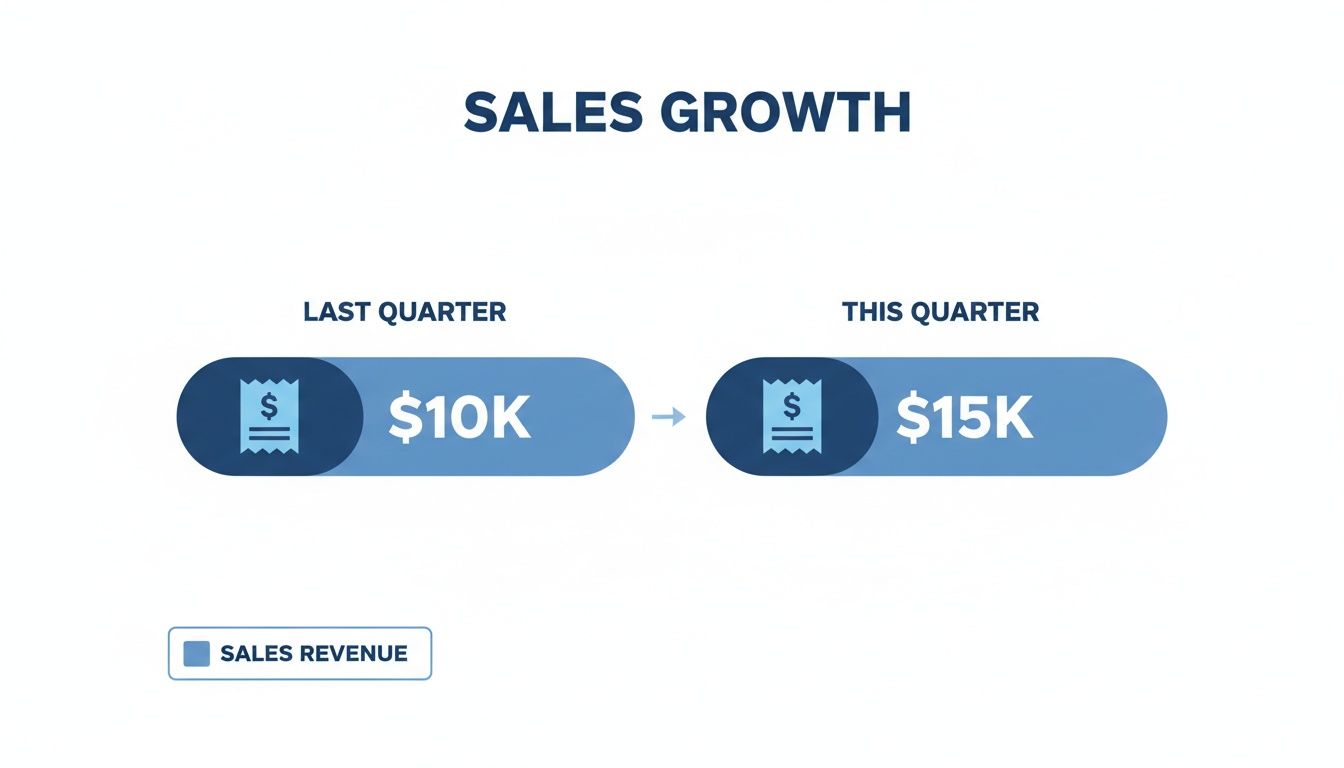
Here, we see a healthy 50% jump in sales from one quarter to the next. That’s a key piece of data for short-term analysis. CAGR takes several of these data points over a few years and uses them to map out a long-term trendline.
The CAGR Formula Unpacked
The formula for CAGR can look a bit intimidating compared to the simple growth rate calculation, but don't sweat it. It's just a way of finding the average growth rate across multiple periods.
CAGR = [(Ending Value / Beginning Value) ^ (1 / Number of Years)] - 1
Let's break that down piece by piece:
- Ending Value / Beginning Value: This part is simple. How much bigger are your sales now compared to when you started the clock?
- ^ (1 / Number of Years): This is where the magic happens. The
^symbol means "to the power of." This step finds the geometric mean, which is just a fancy way of smoothing out the growth over the entire time frame. - - 1: Finally, we subtract one to isolate the growth rate and then multiply by 100 to turn it into a percentage you can actually use.
Putting CAGR into Practice
Let's check back in with our friends at "Cosmic Threads." Say they've been in business for three years and want to understand their actual growth trajectory, not just the quarter-to-quarter bumps.
Here are their annual sales figures:
- Year 1 (Beginning Value): $100,000
- Year 2: $150,000
- Year 3 (Ending Value): $220,000
- Number of Years: 2 (This is the tricky part! The period covers two full years of growth: from the end of Year 1 to the end of Year 3).
Let's plug these numbers into the formula:
- Divide Ending Value by Beginning Value: $220,000 / $100,000 = 2.2
- Calculate the exponent: 1 / 2 years = 0.5
- Apply the exponent: 2.2 ^ 0.5 = 1.483
- Subtract 1 and convert to a percentage: (1.483 - 1) * 100 = 48.3%
So, the Compound Annual Growth Rate for Cosmic Threads is 48.3%.
This single number tells a powerful story. Despite all the ups and downs between months, the business has grown at an impressive, steady average of nearly 50% per year. This is the kind of insight that helps you make smarter long-term decisions and is vital when tracking other important metrics like customer lifetime value. For more on that, check out our guide on how to build a customer lifetime value dashboard.
What Your Sales Growth Rate Actually Means
So, you’ve crunched the numbers and you've got a percentage. Maybe it’s a killer 40%, or maybe it’s a less-than-thrilling 3%. Now what? Is your number good? Bad? Just… meh?
The honest answer is, it completely depends.
Calculating your sales growth rate is the easy part. The real magic happens in the interpretation. That single percentage is a clue, not a conclusion. To figure out what it's really telling you, you need to add some context. It's like hearing the temperature is 70 degrees—is that good? Well, it depends on whether you're in Alaska or Arizona.
Context Is Everything
A "good" sales growth rate isn't some universal number. A startup celebrating 100% month-over-month growth and a Fortune 500 company thrilled with 5% annual growth might both be popping the champagne, and for good reason. Their goals, market position, and sheer scale are worlds apart.
Let's break down the key factors that give your number real meaning:
- Company Size and Age: It’s a whole lot easier for a small company to double its revenue than it is for a corporate giant. A small business jumping from $200,000 to $400,000 in sales just hit a 100% growth rate. A large corporation growing from $20 million to $22 million only sees 10% growth, but they added ten times more revenue.
- Industry Benchmarks: How are you stacking up against the competition? If your industry is booming and the average growth rate is 20%, your 15% might be a sign you're falling behind. On the flip side, if your industry is totally flat and you pull off 5% growth, you're an absolute rockstar.
- Business Goals: Did you just launch a new product? You're probably aiming for aggressive growth. Are you focused on profitability this quarter? You might be perfectly happy with a slower, more sustainable growth rate. The number is only useful when you measure it against what you were trying to achieve in the first place.
Reading the Signals in Your Growth Rate
Your sales growth rate is a powerful health check for your business. It tells a story about your momentum and how well your operations are running. And each type of growth rate sends a different signal.
According to a study by the SaaS Capital, the median annual growth rate for SaaS companies with over $1 million in revenue is around 30%. This highlights why context over time is so crucial for interpreting the health of a business.
A positive growth rate is the clearest sign that things are working. Your marketing is hitting the mark, your sales team is closing deals, and customers want what you're selling. Consistent positive growth points to a healthy, expanding business with a strong position in the market.
A flat growth rate (hovering near 0%) isn't necessarily a disaster, but it's a definite warning sign. It could mean you've hit a plateau, market demand has cooled off, or competitors are starting to eat your lunch. It’s a signal to investigate what's causing the stagnation before it dips into the red.
Finally, a negative growth rate is a red alert. It means your sales are shrinking, and you need to act fast. This could be due to customer churn, ineffective marketing, a struggling economy, or new competition muscling in. It’s a clear call to dive into the data, find the root cause, and pivot your strategy immediately.
Common Pitfalls to Avoid When Tracking Growth
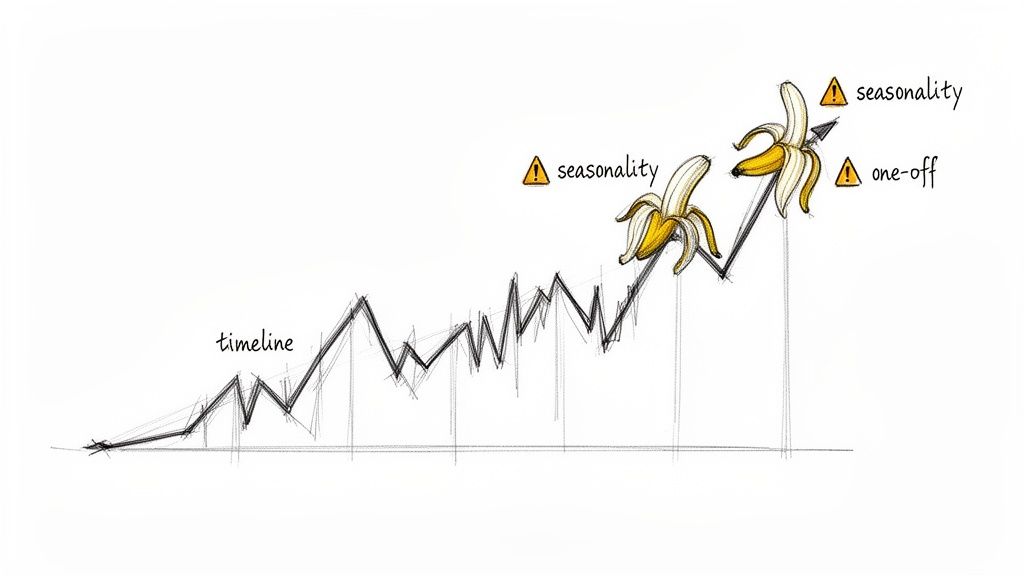
Running the sales growth rate formula feels straightforward, right? But it's surprisingly easy to slip on a few banana peels along the way. Calculating the number is the easy part. Getting an honest number... that's where the real work begins.
A handful of common mistakes can turn your beautiful growth chart into a work of fiction. The good news? They're all totally avoidable. Let's walk through the classic blunders that lead people to the wrong conclusions and figure out how to sidestep them for a true picture of your performance.
Forgetting About Seasonality
Comparing your massive December holiday sales to your sleepy January numbers is like comparing a speedboat to a canoe. It just isn't a fair race. Most businesses have natural peaks and valleys baked into the calendar, and ignoring this seasonality is a surefire way to misread your own growth.
That dip in sales after a huge holiday rush isn't a sign of failure; it's just the tide going out. It's business as usual. To get a real sense of your momentum, you have to compare apples to apples.
- Year-over-Year (YoY) is Your Best Friend: Always, always compare the current period to the same period last year (like Q2 2024 vs. Q2 2023). This simple trick smooths out all those seasonal bumps and gives you a much clearer view of your actual growth trajectory.
Ignoring One-Off Events
Did one of your TikToks go viral last quarter and send sales through the roof? That's awesome! But that massive, unpredictable spike isn't a reliable benchmark for what's going to happen next quarter. One-time events like that can seriously skew your data.
One-off events, like a major product launch or a sudden viral marketing hit, can create huge spikes in your sales data. While fantastic for revenue, these anomalies can distort your understanding of sustainable, repeatable growth if not properly contextualized.
Think of these events as outliers. They're exceptions, not the rule. If you base your future projections on a total fluke, you're setting yourself up for a world of disappointment. It’s critical to make a note of these moments and understand they don’t represent your baseline performance.
Using Inconsistent Time Periods
This one seems obvious, but you'd be surprised how often it happens. Comparing a full 30-day month to a 28-day month (looking at you, February) can throw your numbers off just enough to be maddening. The same thing happens when you compare a five-week month to a four-week one.
To keep your data clean, you have to use consistent, comparable time frames. It's non-negotiable. Whether you're tracking weekly, monthly, or quarterly growth, make sure the duration of each period is identical. This simple discipline prevents small errors from compounding into big misunderstandings about your performance. After all, clean data is the foundation of reliable insights.
Frequently Asked Questions About Sales Growth
Alright, you’ve got the formulas down, you understand the context, and you know what pitfalls to avoid. But if you’re like me, there are probably still a few nagging questions bouncing around in your head. It feels like getting to the end of a puzzle and finding a few extra pieces that don't seem to fit anywhere.
Let's tackle those lingering questions head-on with a quick, no-fluff FAQ.
What Is Considered a Good Sales Growth Rate?
This is the million-dollar question, isn't it? And the honest, slightly frustrating answer is, "It depends." There’s no universal magic number that works for everyone.
Think about it: for a small business jumping from $300,000 to $500,000 in annual sales, that 66% growth rate is absolutely phenomenal. But for a massive corporation, even a 5% increase could mean adding hundreds of millions in new revenue, which is an equally huge win.
A "good" rate really boils down to your specific situation:
- Your Industry: Are you in a red-hot tech sector where double-digit growth is the norm, or a more stable, traditional market? Always benchmark against your direct competitors.
- Company Size: Smaller companies can—and should—grow faster. It's a lot easier to double a small number than a massive one. The law of large numbers is a real thing.
- Business Goals: If you're in a blitz-scaling, venture-backed growth phase, you'll have much more aggressive targets than a bootstrapped company focused on profitability and steady, sustainable progress.
Can a Sales Growth Rate Be Too High?
Surprisingly, yes. Explosive, out-of-control growth sounds like a dream come true, but it can quickly turn into a nightmare if you're not prepared. This is what people mean when they talk about "growing broke."
When sales suddenly skyrocket, you might not have the cash flow, inventory, or staff to keep up with the new demand. This can lead to a cascade of problems: angry customers facing shipping delays, burned-out employees trying to do the work of three people, and a brand reputation that takes a serious hit.
Sustainable, manageable growth is almost always better than chaotic, breakneck expansion that threatens to tear the whole thing apart.
What Is the Difference Between Sales Growth and Revenue Growth?
This one trips people up all the time. The terms are often tossed around interchangeably, but there's a subtle yet important difference you need to know.
Sales growth is a direct measure of your sales and marketing effectiveness. It typically refers to the increase in the number of units you've sold or the total value of sales generated from your core product or service.
Revenue growth, on the other hand, is a much broader financial term. It includes all sources of income for the business. This might be dominated by sales, but it could also include income from investments, subscription fees, licensing deals, or other business activities.
While they're obviously close cousins, sales growth gives you a more focused look at how well you're doing at the fundamental task of selling your stuff.
Ready to stop guessing and start knowing? MetricsWatch automates your client reporting and alerts you to data anomalies in real-time. Ditch the manual spreadsheets and get the clear, actionable insights you need to drive real growth. Start your free trial today and see the difference.


