A Guide to Marketing Agency Reporting That Clients Actually Read

Marketing agency reporting. It's how you prove your value, justify that retainer, and build a real partnership with clients—one that’s based on tangible results, not just good vibes.
It's the process of scooping up data from all the different channels you’re running, analyzing how that performance stacks up against goals, and then handing those findings to your client in a way they can actually understand. And maybe even enjoy. (Okay, let's not get crazy.)
Why Is Client Reporting Such A Headache
Let's be real—building client reports often feels like a full-time job you never signed up for.
It’s a frantic scavenger hunt across Google Analytics, social media ads, email platforms, and a dozen other tools. This digital goose chase usually ends with you staring at a monster spreadsheet that took hours to build and seconds for the client to ignore.

This manual grind isn't just a time-waster; it’s a direct threat to your agency's growth and your clients' happiness. Every hour your team spends wrestling with CSV files is an hour they're not spending on strategy, creative work, or winning new business. It’s a classic case of working in your agency, not on it.
A big part of the struggle is delivering clear and actionable business intelligence reporting. You’ve got all the data, but turning those numbers into a story that screams "we're crushing it for you" is where things usually fall apart.
The Real Cost of Manual Reporting
The inefficiency of manual reporting silently drains your agency's most valuable resources. You hire smart people to be marketers, not human calculators. When your best minds are bogged down with mind-numbing copy-paste tasks, you're not just losing time—you're losing momentum.
This tedious process also swings the door wide open for human error. A misplaced decimal or a miscopied number can erode client trust in an instant. The stakes are just too high for "oops" moments that could have been easily avoided.
Key Takeaway: The hidden cost of manual reporting isn't just the hours you lose. It's the strategic opportunities you miss, the client trust you risk, and the burnout you create for your team.
For a quick, no-fluff comparison, let's look at why clinging to manual reporting is holding your agency back.
The Manual Vs Automated Reporting Smackdown
| Feature | Manual Reporting (The Old Way) | Automated Reporting (The Smart Way) |
|---|---|---|
| Time Investment | Hours (or days) per client, per month. It's a black hole for your team's time. | Minutes to set up, then runs on autopilot. A "set it and forget it" dream. |
| Data Accuracy | Prone to human error. A simple copy-paste mistake can tank your credibility. | Pulls data directly from the source. It's accurate, reliable, and consistent. |
| Scalability | Awful. Every new client adds another huge reporting burden to the pile. | Effortless. Adding a new client is as simple as clicking a few buttons. |
| Actionable Insights | You're so busy compiling data, there's no time left to actually analyze it. | Frees up your team to focus on strategy and find those golden insights. |
| Client Perception | Often looks outdated and unprofessional. It screams "we're doing this by hand." | Sleek, professional, and branded. It shows you're a modern, efficient agency. |
The choice is pretty clear, isn't it? One path is a recipe for burnout and mistakes, while the other is built for growth and client satisfaction.
And the irony? While you're stuck in reporting quicksand, the agency world is moving fast. A recent Agency Benchmarks Report found that a staggering 74% of agencies reported revenue growth, with 49% surging by 25% or more. This growth is directly tied to operational efficiency, and thousands of agencies have already made the switch from manual reports to automated solutions.
Automating your marketing agency reporting is the secret weapon top agencies use to scale efficiently and, frankly, stay sane. It’s about transforming reporting from a dreaded chore into a powerful tool for retention and growth.
Choosing KPIs That Actually Matter to Your Clients
Let's be honest about vanity metrics for a second. Impressions, clicks, and page views are the junk food of agency reporting. They look great on the surface and are super easy to serve up, but they offer zero real value for your client's business.
It's a sugar rush of activity that often leads to a crash when the client finally asks the inevitable question: "...but did we make any money?"
If you want to sidestep that awkward conversation, you have to shift your entire mindset from reporting on activity to reporting on outcomes. This means dropping the fluffy metrics and digging in to find the Key Performance Indicators (KPIs) that connect directly to your client’s bottom line. The goal here is to turn your reports from a boring history lesson into a strategic document that practically screams, "we are making you money."
Ditch the Crystal Ball and Just Ask
You don’t need to be a mind reader to figure out what your clients actually care about. You just need to run a proper discovery session. Before you even think about building a report, sit down with your client and ask questions that go way beyond marketing.
Don't just ask, "What are your marketing goals?" That's surface-level stuff. Instead, try digging deeper with questions like these:
- What are your most important business goals for the next quarter?
- What does a "win" look like for your company as a whole?
- If you could only track three numbers to measure success, what would they be?
- What is your current Customer Acquisition Cost (CAC), and what's your target?
- What is the average Customer Lifetime Value (CLV)?
These kinds of questions cut right through the marketing jargon and get to the heart of what the CEO and finance team actually care about. Their answers are your treasure map to building a report they’ll actually read and value.
Not All KPIs Are Created Equal
The entire foundation of effective reporting is picking out truly relevant KPIs that directly align with what your client is trying to achieve. The KPIs for an e-commerce brand are going to look completely different from the ones for a B2B SaaS company. Trying to use a one-size-fits-all template is a recipe for a client who doesn't renew.
For instance, a B2B SaaS client probably couldn't care less about "add to carts." They live and breathe metrics like the number of Marketing Qualified Leads (MQLs), the MQL-to-SQL conversion rate, and the cost per demo booked. Their sales cycle is long, and your marketing efforts have to align with that specific journey.
On the other hand, an e-commerce client lives and dies by Return on Ad Spend (ROAS). They need to see a direct, undeniable line between the money they're giving you for ads and the money hitting their bank account from sales. Other critical KPIs for them would be Average Order Value (AOV) and the shopping cart abandonment rate.
If you need more help on this, check out our detailed guide on how to choose the right KPIs for client reporting.
This focus on outcome-driven metrics is more important now than ever. Nielsen's Annual Marketing Report recently uncovered a major crisis of confidence: only 54% of global marketers feel sure about their ability to measure ROI. This uncertainty is exactly why agencies that report on clear, money-making KPIs build unbreakable client trust.
Client Perspective: "I don't need another report filled with charts I don't understand. I need to know if the money I'm spending with you is growing my business. Show me the ROI, and you'll have a client for life."
To help you get started moving beyond those flimsy vanity metrics, I've put together a quick cheat sheet. Think of these as examples of powerful, goal-oriented KPIs for different types of agency clients.
KPIs That Get You Renewed
This table shows how to swap out a fluffy, feel-good metric for a KPI that actually proves your value and ties directly to a business goal.
| Client Type | Bad KPI (Vanity Metric) | Good KPI (Business Goal) |
|---|---|---|
| E-commerce Store | Website Traffic | Return on Ad Spend (ROAS), Customer Lifetime Value (CLV) |
| B2B SaaS Company | Social Media Followers | Cost per Marketing Qualified Lead (MQL), Lead-to-Customer % |
| Local Service Business | "Likes" on a Facebook Post | Number of Phone Calls, Cost per Scheduled Appointment |
| Content Publisher | Page Views | Email Subscribers from Content, Average Time on Page |
By tailoring your KPIs to each client's specific business model, you stop treating reporting as a chore. Instead, it becomes your single most powerful tool for keeping clients happy and proving your worth, month after month.
Building Your Scalable Reporting System
Okay, enough theory. Let's stop talking about messy reporting and actually build your well-oiled reporting machine. The whole point is to create a repeatable system that pumps out professional, white-labeled reports without that monthly copy-and-paste headache.
The secret isn’t some mythical, one-size-fits-all report. It’s all about building a master reporting template to act as your rock-solid foundation.
This isn't about being rigid; it's about being smart. A great template saves you from reinventing the wheel for every single client, every single month. That frees you up to focus on the insights, not the setup.
The Anatomy of a Report That Doesn't Get Ignored
Think of your report template as having a few non-negotiable sections. These are the building blocks that make sure every report you send is clear, valuable, and actually answers the client's biggest question: "Is this working?"
Your template absolutely must include these four core parts:
- A Human-Friendly Executive Summary: This is your elevator pitch. Kick things off with 2-3 bullet points written in plain English. Summarize the big wins, key learnings, and what happened this month. No jargon allowed.
- Performance vs. Goals Visual: A simple, clean chart showing your main KPIs plotted against the goals you set together. This visual is often the first thing a busy client looks at, so make it impossible to misinterpret.
- Channel-Specific Breakdowns: Here’s where you can get a little more granular. Dedicate a small section to each channel you’re managing (like Google Ads, SEO, or Social Media) and show the key metrics that drove the overall results. Keep it focused.
- The "What's Next" Section: This is arguably the most important part. It’s where you shift from historian to strategist. Clearly outline your key takeaways and list the top 2-3 action items you'll be focusing on next month based on what the data is telling you.
This structure turns your report from a passive data dump into an active strategy document. It proves you're not just executing tasks; you're thinking, learning, and steering the ship.
Choosing Your Reporting Tech Stack
You can't build a modern reporting system with old-school tools. Manually exporting CSVs from ten different platforms is just a recipe for errors and burnout. The smart move is to use a reporting platform that acts as your central data hub.
These tools are built to automatically pull data from all the places you work—Google Analytics, Google Ads, Facebook Ads, SEO tools, you name it—and consolidate it into one clean, beautiful dashboard.
The right platform doesn't just save you time; it professionalizes your entire client experience. Research from HubSpot shows that a whopping 85% of agencies use reporting tools specifically for their white-labeling capabilities, making sure every report reinforces their brand, not someone else's.
A solid reporting tool is the engine of your scalable system. It handles the tedious data collection so your team can focus on finding the story within the numbers. For a simple visual of how this process should flow, from discovery to the final report, check out the diagram below.
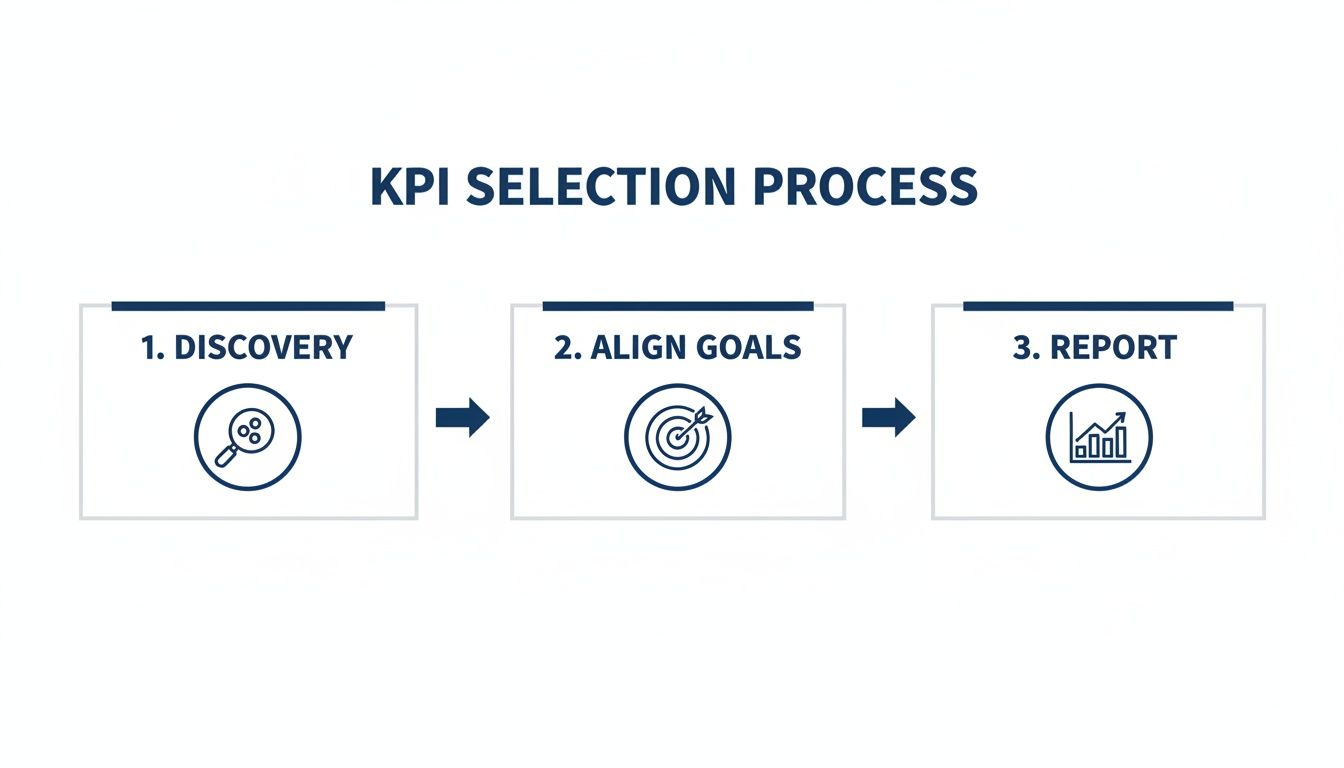
This highlights how a systematic approach, powered by the right tools, ensures you're always reporting on what truly matters to the client's bottom line.
Creating a Repeatable Workflow
Once you've got your template and your tech stack sorted, the final piece is creating a repeatable workflow that your whole team can follow. This isn't about micromanaging; it's about consistency and quality control.
Your workflow should be ridiculously simple. Something like this:
- Duplicate the Master Template: At the start of a new reporting period, make a copy of your master template for the client.
- Connect the Data Sources: Link the client's specific accounts (Analytics, Ads, etc.) to the new report. Your reporting tool should make this a one-time setup.
- Review and Add Insights: The data will populate automatically. Now, your job is to go in and write the executive summary and the "What's Next" section. This is where your human expertise really shines.
- Schedule and Send: Set the report to be delivered to the client's inbox automatically on a specific day each month.
This systemized approach ensures that no matter who on your team is handling the account, the client receives the same high-quality, professional report every time. Tools like MetricsWatch are built for this exact purpose, letting you automate the delivery of beautiful, white-labeled email reports.
By building a scalable system like this, you transform reporting from your agency's biggest bottleneck into one of its greatest strengths.
Putting Your Marketing Agency Reporting on Autopilot
Automation is how you finally get off the reporting hamster wheel. This is where we dive into setting up reports that practically build and send themselves, freeing you up to focus on the work that actually moves the needle for your clients.
Let's start with the basics. The first step is simply scheduling reports to land in your client's inbox automatically. Whether it's daily, weekly, or the first Monday of every month, automated delivery means you never have to hear, "Hey, where's my report?" ever again.
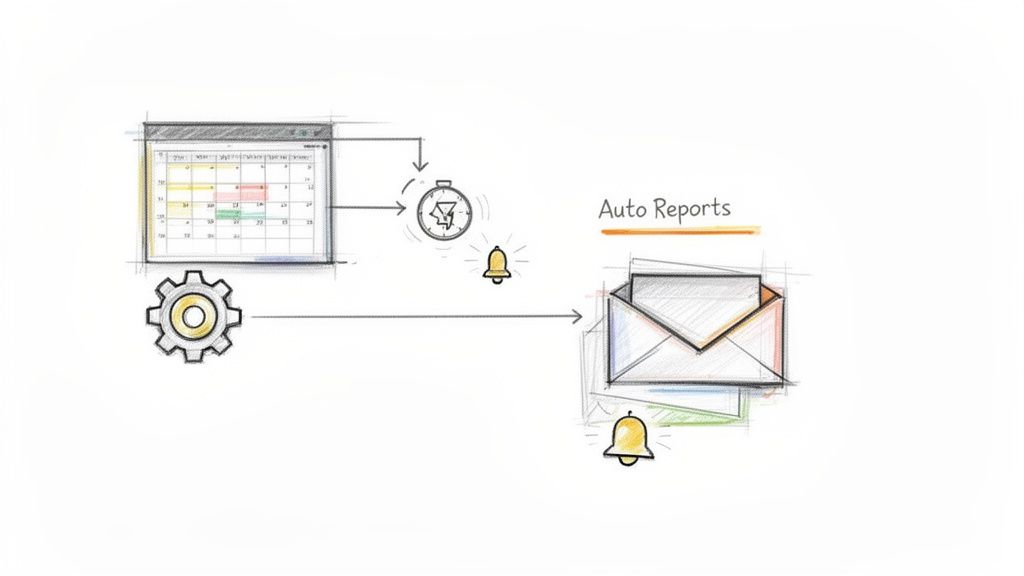
This isn't just about saving a few minutes sending an email, either. It’s about creating a rhythm of reliability. When a client knows their report will arrive like clockwork, it builds a foundation of trust and professionalism without you lifting a finger. It immediately positions your agency as a dependable partner who has their act together.
Going Beyond Simple Delivery
But true automation is so much more than a scheduled email. The real magic happens when your reporting system becomes proactive.
Imagine getting a Slack alert the second your client's website traffic tanks or their ad spend goes haywire. That's next-level automation.
Setting up these kinds of proactive alerts transforms your agency from a reactive historian—who only reports on what already happened—into a proactive partner. You become the one who spots and solves problems before the client even knows they exist.
Here are a few game-changing alerts you can set up right now:
- Sudden Traffic Drop: Get a ping if organic traffic drops by more than 15% day-over-day. This could signal a technical SEO issue or a Google algorithm update you need to jump on immediately.
- Ad Spend Spikes: Set an alert for when daily ad spend on a campaign exceeds its budget by 10%. This helps you catch runaway costs before they blow through the monthly budget.
- Conversion Rate Plummets: An alert for a sudden drop in a key landing page's conversion rate could mean a form is broken or a new design isn't resonating with users.
- Goal Completions Go to Zero: If a critical goal like "Contact Form Submission" stops firing, you need to know right now, not at the end of the month.
This proactive approach is how you build incredible trust and demonstrate your value around the clock, not just during your monthly review call. For a deeper look, check out these 7 practical ways to automate client marketing reports.
Why Automation Drives Recurring Revenue
This shift from manual to automated isn't just a nice-to-have efficiency boost; it’s a core driver of agency stability. Consistent, valuable reporting is one of the biggest factors in client retention. It constantly reminds them why they hired you in the first place.
When your reports are automated, consistent, and insightful, they become a cornerstone of your client relationship. You’re not just a vendor they pay; you’re an integrated part of their growth engine.
This has a massive impact on the financial health of your agency. In fact, research from Promethean Research shows that over 50% of agencies say that 50% or more of their revenue is recurring. Automated, consistent reporting is a key pillar supporting this recurring revenue, as it demonstrates continuous value and makes clients far less likely to churn.
Ultimately, putting your reporting on autopilot isn't about being lazy. It’s about being strategic. It frees up your best people to do what they do best: analyze, strategize, and get amazing results for your clients.
How to Present Reports Without Boring Your Clients
Hitting 'send' on a report is easy. But getting a client to actually read it, understand it, and care about the numbers you just sent? That’s the real trick. Let’s be honest, nobody gets excited about another PDF attachment packed with charts.
This is your playbook for turning that dry data review into a must-see strategy session. It's how you transform your monthly check-in from a boring obligation into your single best opportunity to prove you're an indispensable part of their team.
Frame Data as a Story
Numbers are just numbers until you give them a plot. Your job isn't to be a human calculator; it's to be a storyteller. Every report has a narrative with a beginning (last month's goals), a middle (this month's actions and results), and an end (next month's strategy).
Instead of just saying, "Traffic went up by 15%," try framing it as a story.
For example: "Remember that blog series we launched on Topic X? It absolutely crushed it, driving 15% more organic traffic this month. Even better, those new visitors are converting 5% higher than average. That's a huge win."
See the difference? One is a fact; the other is a victory. This approach turns metrics into milestones.
How to Structure the Review Call
Whatever you do, don't just walk through the report page by page. That’s a one-way ticket to your client checking their email while you talk. You need to lead with the good stuff and make the conversation interactive.
Here’s a simple structure that works wonders:
- Start with the Executive Summary: Open with the biggest wins and key takeaways. Give them the headline news first to grab their attention and set a positive tone.
- Focus on Goals: Immediately connect the results back to the KPIs and business goals you established together. Show them the "Performance vs. Goals" chart and explain why you hit or missed the target.
- Explain the "Why": This is where you shine. Don't just show a chart; explain what it means. "Our Cost per Lead went down because the new ad creative we launched is resonating way better with the target audience."
- End with "What's Next": Always close by looking forward. Reiterate your action items for the next month to show you're proactive and already working on the next win.
This structure reinforces your strategic partnership. You’re not just a vendor reporting on the past; you’re a guide showing them the path forward.
Tackling the Tough Questions
Sooner or later, the numbers will be down. It happens. The absolute worst thing you can do is gloss over it or get defensive. Your client’s trust is on the line, and how you handle bad news is a massive test.
When performance dips, own it. Be the first to bring it up and come prepared with a plan.
Pro Tip: Never present a problem without also presenting a solution. Say, "Our conversion rate dipped this month. We dug in and found the issue was a broken form on our main landing page. We've already fixed it and implemented a new QA check to ensure it never happens again."
Accountability builds more trust than a perfect report ever could. It's also a serious responsibility. Inaccurate or misleading reporting can have real consequences. While it's a different industry, a recent FTC case found a company had filed inaccurate reports, leading to a $60,000 penalty. It's a stark reminder that accuracy and transparency are non-negotiable.
Ultimately, presenting your marketing reports is less about the data and more about the dialogue. Make it a conversation, tell a story, and always connect your work back to their success.
If you're looking for more ways to make your data pop, explore these 10 data presentation tips for marketing dashboards.
Scaling Your Reporting as Your Agency Grows
The reporting system that got you to five clients will absolutely buckle under the weight of fifty. Growing your agency is the goal, but you don't want to scale your stress levels right along with it. The secret is to build a system now that's ready for the future—one where adding a new client makes things smoother, not more chaotic.
It all boils down to standardization. You need a master template that can be quickly spun up for each new client. Now, standardization doesn't mean churning out boring, cookie-cutter reports. It’s about building a consistent framework that your team knows inside and out, and that your clients learn to expect.
The Power of Consistent Branding
As you grow, your brand is everything. Every single piece of communication you send, especially a report, is a chance to reinforce that brand. This is where white-labeling becomes non-negotiable.
Think about it. A sleek, professionally branded report landing in your client's inbox every month does more than just deliver data. It sends a message: "We are organized, we are professional, and we are on top of our game." Using a central reporting platform is the only way to nail this consistency every single time.
By standardizing and white-labeling your reporting, you create a polished, uniform client experience. That consistency is gold for building a strong agency brand that clients trust as you scale.
This isn't just about slapping your logo on a PDF, either. It’s about owning the entire experience. Every font, every color, every chart should scream your agency. That professional touch makes your services feel more premium and builds the kind of brand equity that helps you land bigger and better deals down the road.
Templates as Your Quality Control
A centralized reporting platform with master templates isn't just about saving time; it's your secret weapon for quality control. It sets a baseline for excellence, guaranteeing that every single report that goes out the door is flawless and complete.
Here’s how this plays out in the real world:
- No More "Whoops" Moments: A solid template ensures critical sections—like the executive summary or the "what's next" plan—are never accidentally left out. We've all been there.
- Easy Team Onboarding: When a new account manager joins, they can get up to speed in hours, not weeks. They just grab the template, plug in the client's data, and can immediately focus on adding their strategic insights.
- Client-Specific Tweaks: The best systems give you both standardization and customization. Your master template handles 80% of the work, but you can easily pop in a custom widget or chart for a client with unique needs without wrecking the whole process.
Ultimately, scaling your reporting is about building a well-oiled machine. It’s about creating a process so smooth that your team can focus on client strategy instead of fighting with spreadsheets. This is how you set the stage for sustainable, chaos-free growth.
Common Questions About Agency Reporting
You've got questions, we've got answers. When it comes to agency reporting, a few key questions always seem to pop up. Let's tackle them head-on so you can report with total confidence.
How Often Should I Send Reports?
This is the golden question, isn't it? The honest answer is that it really depends on the client and the intensity of your work. Don't just default to a monthly report because it feels like the "standard" thing to do.
- Weekly Reports: These are perfect for new clients in their first 90 days or during a high-stakes campaign launch. They offer a ton of reassurance and let you make quick pivots when needed.
- Monthly Reports: This is the sweet spot for most retainer clients. It’s frequent enough to show real progress but also gives the data enough breathing room to reveal meaningful trends.
- Quarterly Reports: These are best saved for long-term SEO campaigns or clients who are more focused on big-picture business growth. Quarterly reports should zoom out to focus on major trends and strategic planning for the next 90 days.
The most important thing is to set these expectations right from the start. A recent study by UpCity found that a staggering 80% of clients who leave their agencies point to poor communication as the reason. Setting a clear reporting cadence is one of the easiest ways to nail that communication from day one.
What If the Numbers Are Bad?
Sooner or later, it’s going to happen. You’ll have a month where the numbers are down. It happens to every single agency. The absolute worst thing you can do is hide, get defensive, or try to spin bad news into good news. Your client’s trust is on the line.
Be the first one to bring it up. And never, ever present a problem without also presenting a clear, actionable plan to fix it. This approach completely reframes a negative result into a powerful demonstration of your agency's proactive, problem-solving skills.
For example, don't just say, "Traffic is down."
Instead, try this: "We saw a dip in organic traffic this month. We’ve already identified a technical SEO issue as the cause, and our team is deploying a fix as we speak. We expect to see a full recovery within the next two weeks."
See the difference? Accountability builds far more trust than a perfect report ever could.
Do I Need a Dedicated Reporting Tool?
Look, can you get by without one? Maybe for your first client or two. But if you have any real plans to grow, a dedicated reporting tool isn't a luxury—it's a necessity for scaling efficiently.
Manually pulling data from half a dozen different sources is a recipe for mistakes, burnout, and wasted hours. A proper reporting tool automates all that grunt work, ensures your data is accurate, and gives you that professional, white-labeled look that helps you command higher retainers.
Think of it as a direct investment in your agency's efficiency and professionalism.
Ready to stop wrestling with spreadsheets and start sending reports that clients actually love? MetricsWatch automates the entire process, delivering beautiful, white-labeled reports directly to your clients' inboxes. Try MetricsWatch free and see how much time you can save.


