12 Best Management Report Templates to Save Your Sanity in 2026

Let's be real, creating management reports is a chore. You spend hours wrestling with data, fighting with formatting, and trying to make a spreadsheet look like it wasn't beamed in from 1998. The worst part? You get to do it all over again next week.
It’s not just you. Research from MIT Sloan shows managers waste about 20% of their time on tasks that could be automated. Guess what’s high on that list? Yep, manual reporting. This soul-crushing cycle of exporting and formatting keeps you from the important stuff: finding the story in the data. The goal isn’t to build a report; it's to make a decision, spot a trend, or prove your team isn't just watching cat videos all day.
This article is your official intervention. We’ve found the absolute best management report templates online. We'll cover everything from simple Word and Excel files to fully automated dashboards that do the work for you. To streamline your process, exploring various template sources can be a lifesaver. For instance, check out the range of Orbitforms templates for different business needs.
In this guide, you’ll find:
- A curated list of the top 12 platforms and resources.
- Direct download links and screenshots for each template.
- Quick insights on which template is best for specific scenarios (e.g., weekly marketing updates, quarterly executive summaries).
Steal these, customize them, and get back to the work that actually matters. Your sanity will thank you.
1. MetricsWatch
MetricsWatch is a specialized analytics reporting platform that offers a powerful, automated alternative to building management report templates from scratch. Instead of giving you a file to download, it gives you a system for creating, customizing, and automating data-rich reports sent straight to your inbox. This focus on automation makes it a top choice for agencies and marketing teams who are so over static spreadsheets.
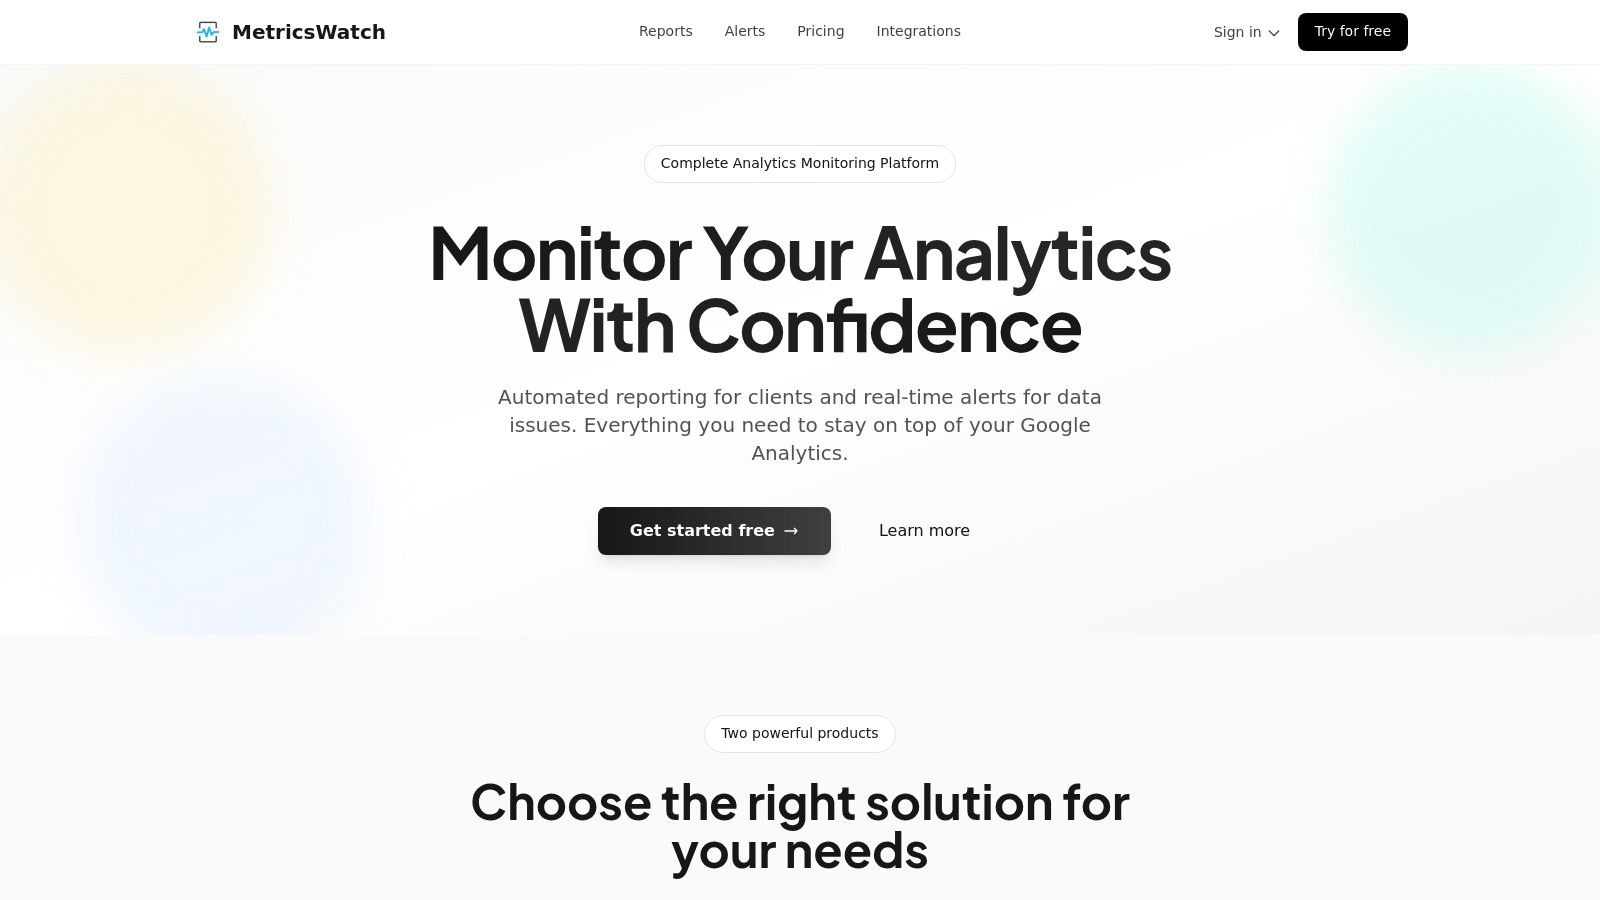
The platform's big win is automatically pulling data from multiple sources like Google Analytics, Google Ads, and social media into one clean email report. This saves a frankly absurd amount of time. According to a survey by Wakefield Research, marketers spend nearly a full workday each week just preparing reports. MetricsWatch gives you that time back, letting you schedule daily, weekly, or monthly reports that are fully white-labeled for your clients.
Key Features & Use Cases
- Automated White-Label Reporting: The main draw is setting up recurring reports that blend data from different marketing channels. Perfect for agencies that need to send professional updates to multiple clients without the manual grind.
- Real-Time Anomaly Detection: Its "Alerts" product is a neat feature that monitors your analytics for sudden drops or spikes. It can spot issues like broken tracking codes or traffic outages in as little as 10 minutes, preventing data disasters that would otherwise ruin your reports.
- Centralized Monitoring: Connecting multiple data sources gives you a single view of performance, making it easier to spot trends and figure out what’s going on.
Platform Analysis
| Feature | Assessment |
|---|---|
| Ease of Use | The setup is fast, with alerts configured in minutes. The interface is clean and focused, not bloated with features you'll never use. |
| Customization | Offers strong customization for reports, including branding, KPI selection, and data source integration. |
| Pricing | Transparent pricing starts at $49/month for the Reports product and $99/month for Alerts. A no-credit-card free trial is available. |
| Support & Validation | While the platform makes strong claims (like zero false positives), the website could use more public case studies for independent validation. |
MetricsWatch is an excellent fit for anyone who knows that manual reporting and data blind spots cost real money. The subscription fee might be a hurdle for some, but the time savings offer a clear and compelling ROI.
Learn more at MetricsWatch.com
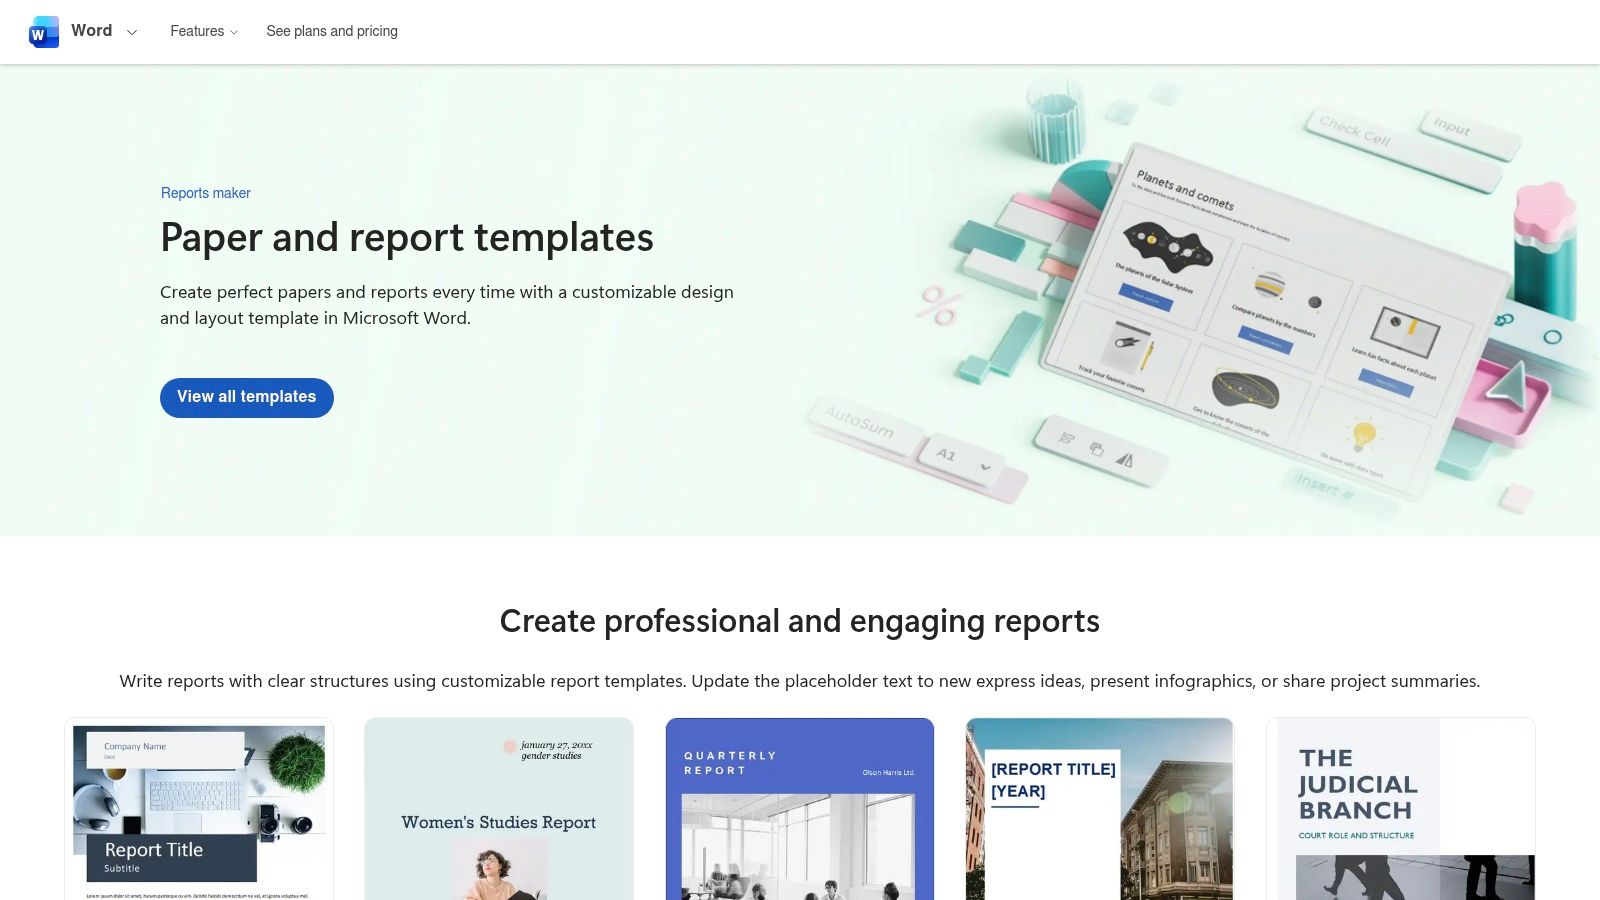
2. Microsoft Create (Office/Word/Excel/PowerPoint templates)
For teams living in the Microsoft universe, the official template gallery at Microsoft Create is the path of least resistance. It offers a huge library of management report templates designed to work perfectly within Word, Excel, and PowerPoint. This is your go-to when you need a report that looks professional and can be easily shared with coworkers who live and breathe Office docs.
Why It's a Top Choice
The biggest advantage is that it just works. No weird file conversions or messed-up formatting. You find a template, click it, and start editing. Many templates are free, though the slickest designs are often for Microsoft 365 subscribers. The designs can feel a bit "corporate," but for formal executive summaries, their reliability is unmatched.
Key Features & User Experience
- Native Integration: Templates open directly in Word, Excel, or PowerPoint with one click.
- Vast Selection: Find layouts for everything from annual financial reports to weekly project updates.
- Freemium Model: A solid collection is free, with premium options for Microsoft 365 subscribers.
- Brand Safety: Templates use standard fonts and colors, so they won't look weird on someone else's computer.
This is perfect for generating static, formal documents that fit into established company workflows.
Link: Microsoft Create Papers & Reports
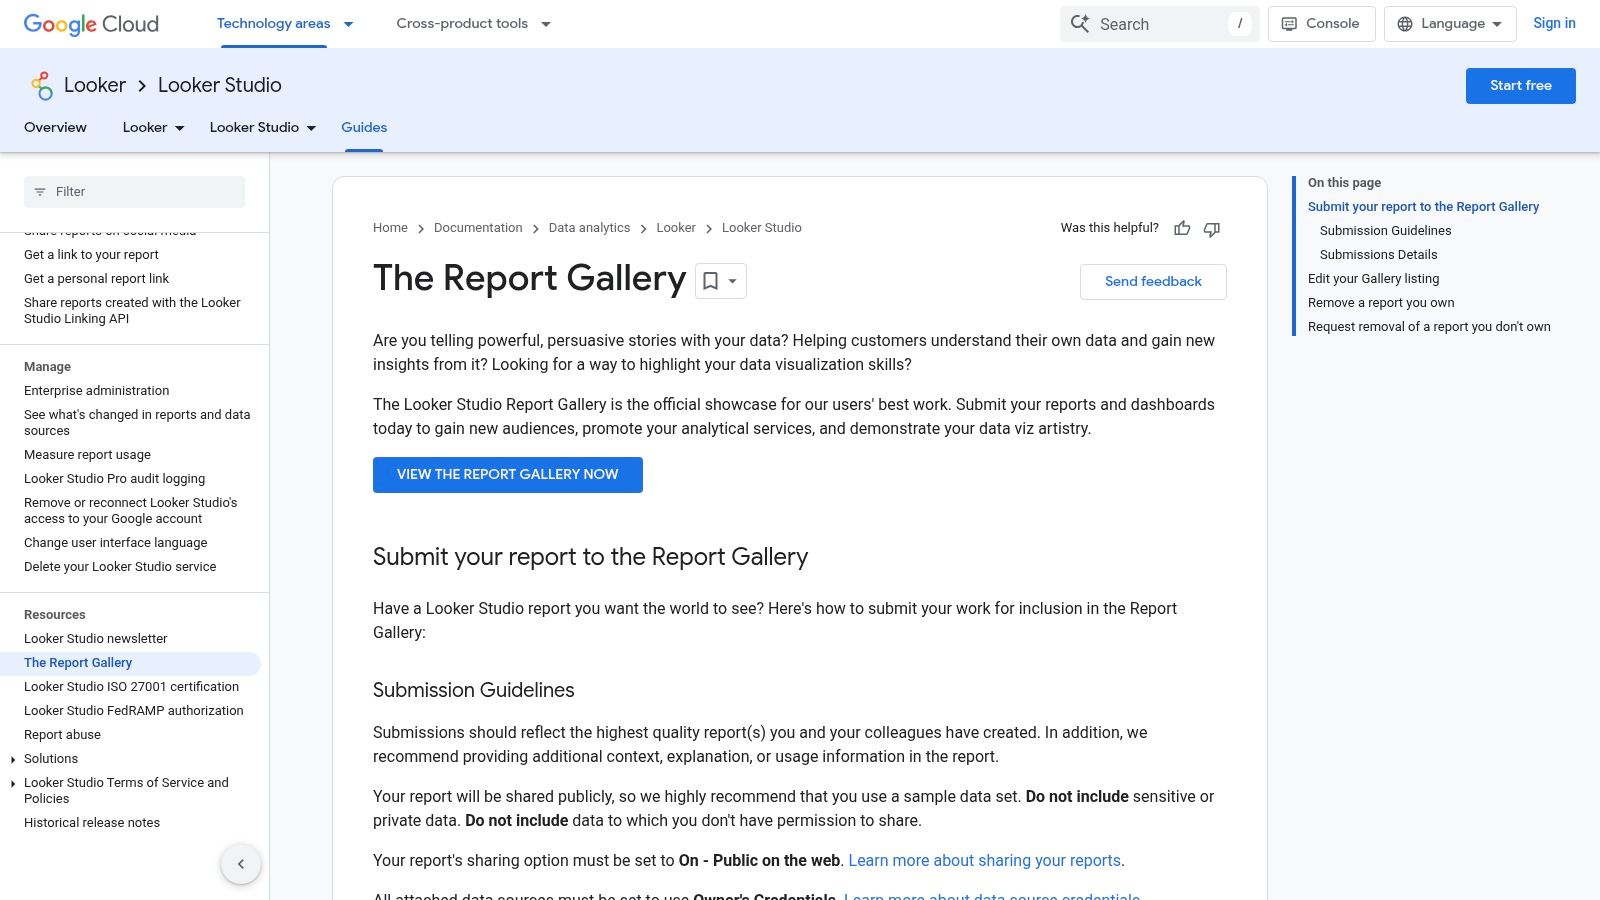
3. Google Looker Studio Report/Template Gallery
For organizations in the Google ecosystem, Looker Studio (formerly Data Studio) is the undisputed champ of automated reporting. Its gallery is a goldmine of management report templates that connect directly to live data sources like Google Analytics and Google Ads. This is what you use when manually updated reports just won't cut it anymore.
Why It's a Top Choice
The killer feature is the live data connection. Instead of copying and pasting new numbers every week, you build a report once, and it updates automatically. The gallery offers a fantastic starting point for marketing and web analytics dashboards. Best of all, it’s completely free, making it super accessible for businesses of any size.
Key Features & User Experience
- Live Data Connectors: Instantly pull data from Google Analytics 4, Google Ads, YouTube Analytics, and more.
- One-Click Cloning: Find a template you like, copy it, and connect your own data in minutes.
- Community-Driven Gallery: Access a wide variety of dashboards made by Google and other analytics pros.
- Fully Interactive: Viewers can adjust date ranges and apply filters for deeper analysis.
This is perfect for creating dynamic, self-updating dashboards that give you an always-on view of key business metrics.
Link: Google Looker Studio Report Gallery
4. Canva Templates (Reports/Business Documents)
When your report needs to look less like a spreadsheet and more like something a designer made, Canva is the answer. It has a giant library of management report templates, all editable right in your browser. This is the best platform for creating visually stunning, client-facing reports that need to impress without requiring any design skills.
Why It's a Top Choice
Canva's key advantage is its speed and ease of use. For non-designers, applying a brand kit (logos, colors, fonts) with one click is a game-changer. The templates are perfect for monthly summaries or project proposals where looks matter as much as the data. Applying marketing report design best practices for 2025 is incredibly simple with Canva's drag-and-drop interface.
Key Features & User Experience
- Web-Based Editor: No software to install. The editor is intuitive and makes customization fast.
- Massive Template Library: Access thousands of designs for reports, white papers, and business documents.
- Brand Kits: (Pro feature) Instantly apply your company's branding to any template for consistent reports.
- Flexible Exports: Download your report as a high-quality PDF, PPTX file, or even PNG images.
While many templates are free, the best stuff is often behind a Canva Pro subscription, but it's usually worth it for teams that produce a lot of visual content.
Link: Canva Templates
5. Adobe Express Templates (Reports)
When you want your report to tell a visual story, Adobe Express is your best bet. It offers a library of management report templates focused on modern design. This browser-based tool is perfect for creating polished reports like monthly summaries or project updates without needing the full Adobe Creative Suite.
Why It's a Top Choice
The key advantage of Adobe Express is its simple drag-and-drop editor, which makes creating beautiful reports accessible to everyone. You can quickly add brand elements, charts, and high-quality stock images to make your data pop. It’s less suited for dense financial documents but excels at producing one-pagers or short visual summaries.
Key Features & User Experience
- Drag-and-Drop Editor: An intuitive, web-based interface for customizing layouts and adding images.
- Hundreds of Templates: A vast collection covering monthly reports, project proposals, and white papers.
- Collaboration Tools: Easily share your design with team members for feedback and co-editing.
- Freemium Model: Offers a generous free plan, with premium templates and features on a paid subscription.
This is ideal for teams who prioritize visual impact and need professional-looking reports without a dedicated designer.
Link: Adobe Express Report Templates
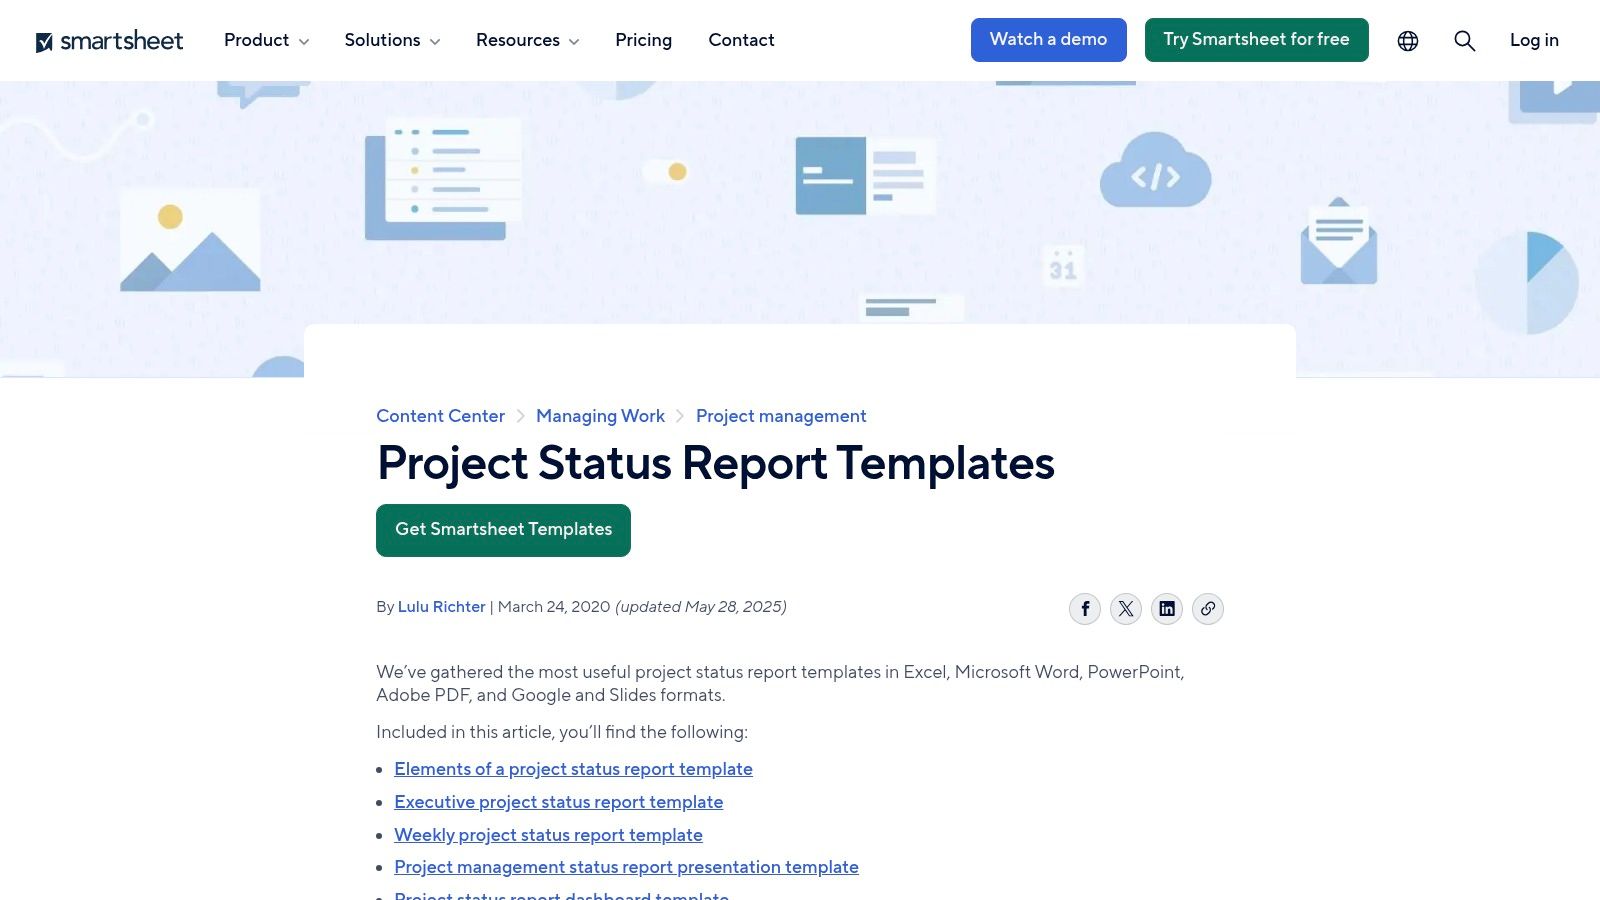
6. Smartsheet (Downloadable Management/Status Report Templates)
Smartsheet offers a curated collection of free, business-focused management report templates designed for practicality over flair. This resource is great for managers who need functional, ready-to-use documents for project status or executive summaries. The templates are available in multiple formats like Word and Excel, making them super versatile.
Why It's a Top Choice
Smartsheet excels by providing layouts that are immediately useful in a corporate setting. You'll find templates pre-populated with sections like RAG (Red-Amber-Green) status, key milestones, and budget tracking. While the landing pages promote the paid Smartsheet platform, the downloadable files are clean and free. It’s a no-nonsense approach to generating standardized reports quickly.
Key Features & User Experience
- Multiple Formats: Download templates as Word, Excel, PowerPoint, Google Docs, or PDF files.
- Business-Centric Design: Layouts are built for common management needs like executive status updates.
- Free to Download: All downloadable templates are free, though using them in the Smartsheet software requires a subscription.
- Practical Elements: Many templates include built-in RAG statuses and KPI trackers, saving you setup time.
This platform is perfect for project managers and team leads who need a reliable, professional template without the design overhead.
Link: Smartsheet Project Status Report Templates
7. Envato Elements (Subscription Marketplace)
For those who need a truly polished, publication-ready design, Envato Elements is the creative pro's secret weapon. It’s a subscription marketplace offering unlimited downloads of premium management report templates, with a heavy focus on Adobe InDesign and PowerPoint. This is where you go when a Word doc won't cut it and you need an annual report that looks like it came from a design agency.
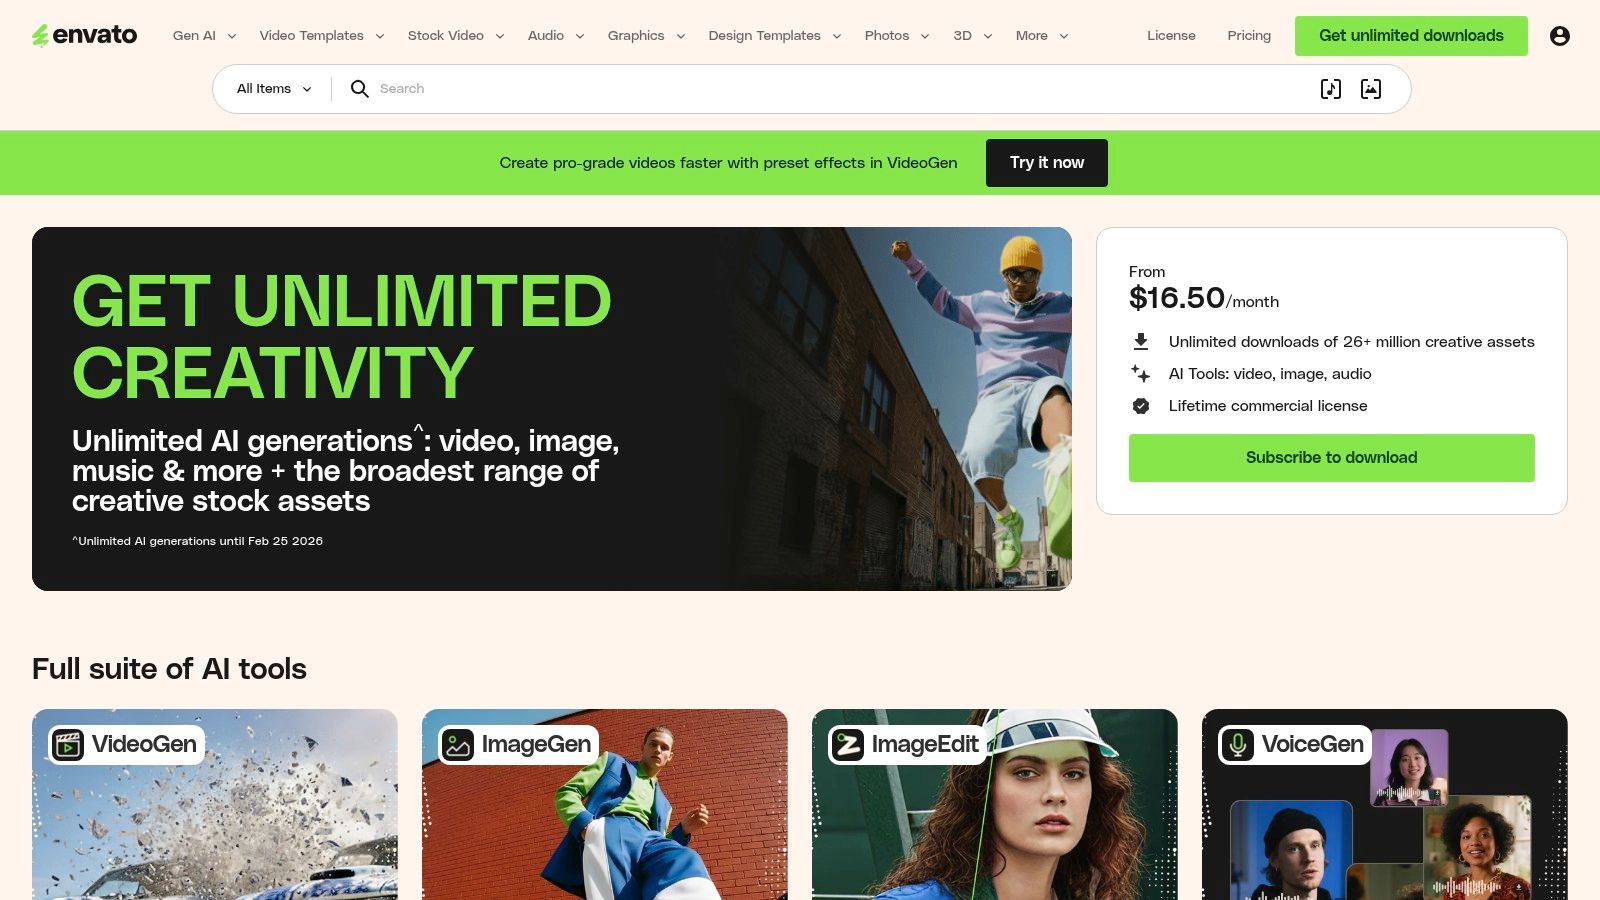
Why It's a Top Choice
Unlike free template sites, Envato Elements provides professionally designed kits complete with master pages and paragraph styles. A single subscription unlocks a massive library, saving countless hours on layout design. The downside? It’s a paid subscription, so assets aren't sold individually.
Key Features & User Experience
- Professional Design Focus: Specializes in high-quality InDesign and PowerPoint templates for formal presentations.
- Unlimited Downloads: A single subscription provides access to the entire library of report templates.
- Print-Ready Formats: Many templates come pre-formatted for professional printing.
- Structured Layouts: Includes pre-set paragraph styles, making it easy to maintain consistency across many pages.
This is perfect for teams that need to produce visually impressive documents and have access to design software like Adobe InDesign.
Link: Envato Elements
8. Creative Market (Pay‑per‑item templates)
For those who need a unique design and want to avoid another monthly subscription, Creative Market is the ideal spot. It's a huge marketplace where independent designers sell their high-quality management report templates for a one-time fee. This is the place to go when you need a report that looks more like a professionally designed publication.
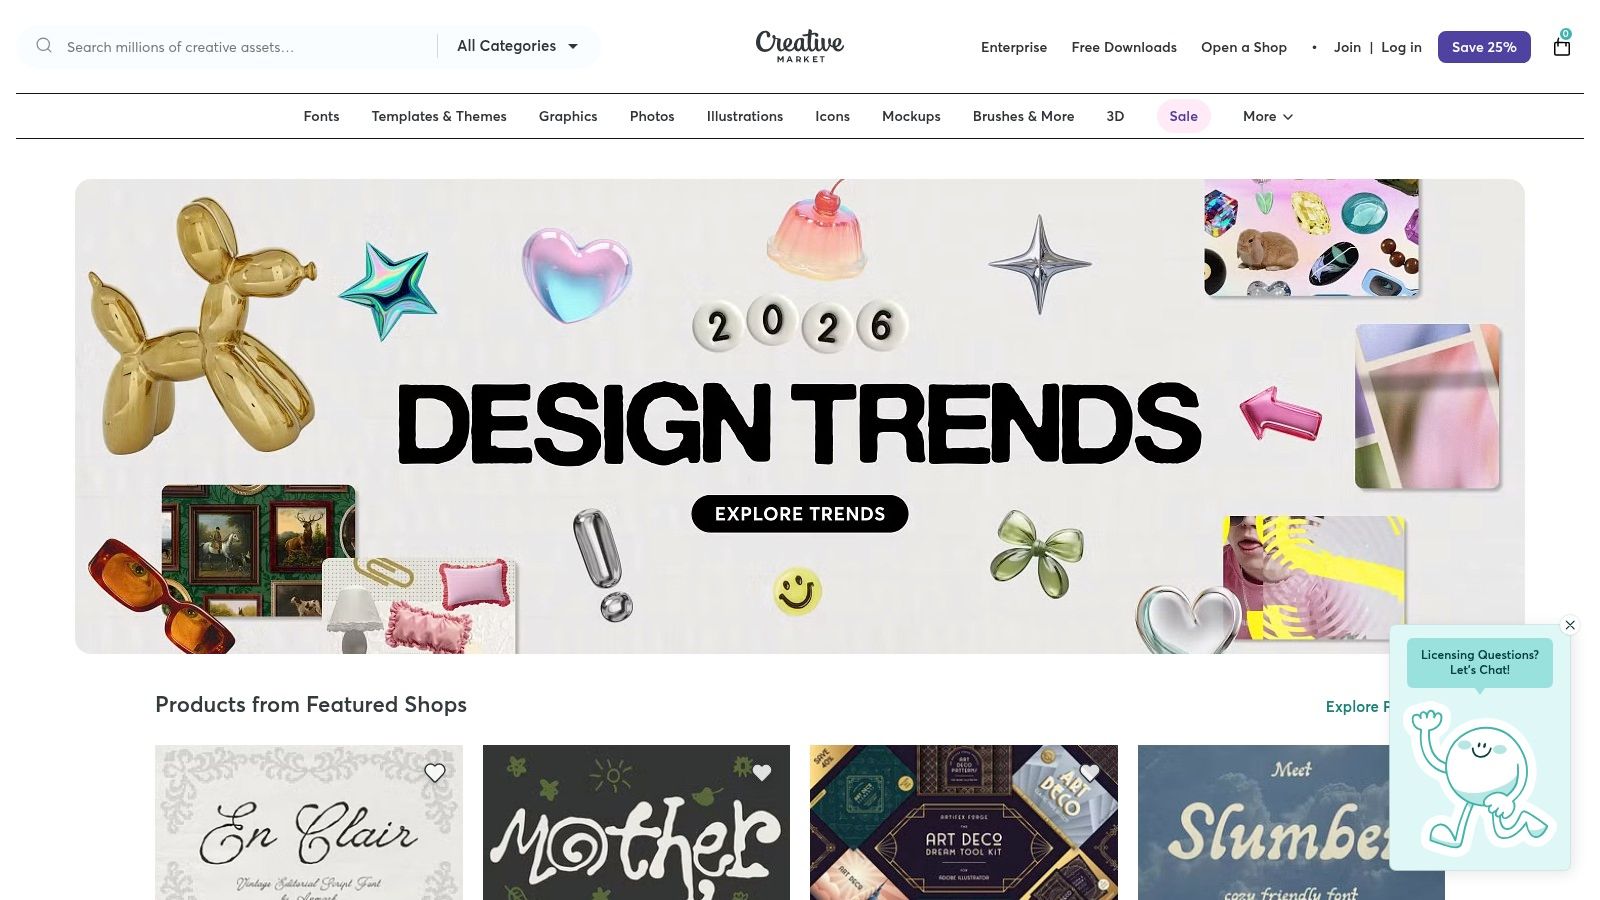
Why It's a Top Choice
The "pay-per-item" model is perfect for one-off projects. Instead of being locked into a limited style library, you get access to thousands of creative aesthetics. It’s like commissioning a designer for a fraction of the cost. Since you're buying from individual creators, quality can vary, so always read the descriptions and reviews.
Key Features & User Experience
- Pay-Per-Item Model: Buy a template once and own the license for it without recurring fees.
- Vast Creative Variety: Access thousands of designs from independent creators.
- Multi-Format Support: Many templates come with versions for different software, like InDesign, Word, and Canva.
- Creator-Driven Quality: Templates often include extras like defined paragraph styles and help documentation.
This platform is best for creating high-impact reports for special presentations where design matters as much as data.
Link: Creative Market
9. Databox (Dashboard/Report Templates)
For managers who want their data live and automated, Databox is less a template library and more a command center. It offers over 300 pre-built dashboards that serve as dynamic management report templates. Instead of manually updating a document, you connect your data sources once, and the dashboards update in real time. This is the solution for data-driven teams that need immediate insights.
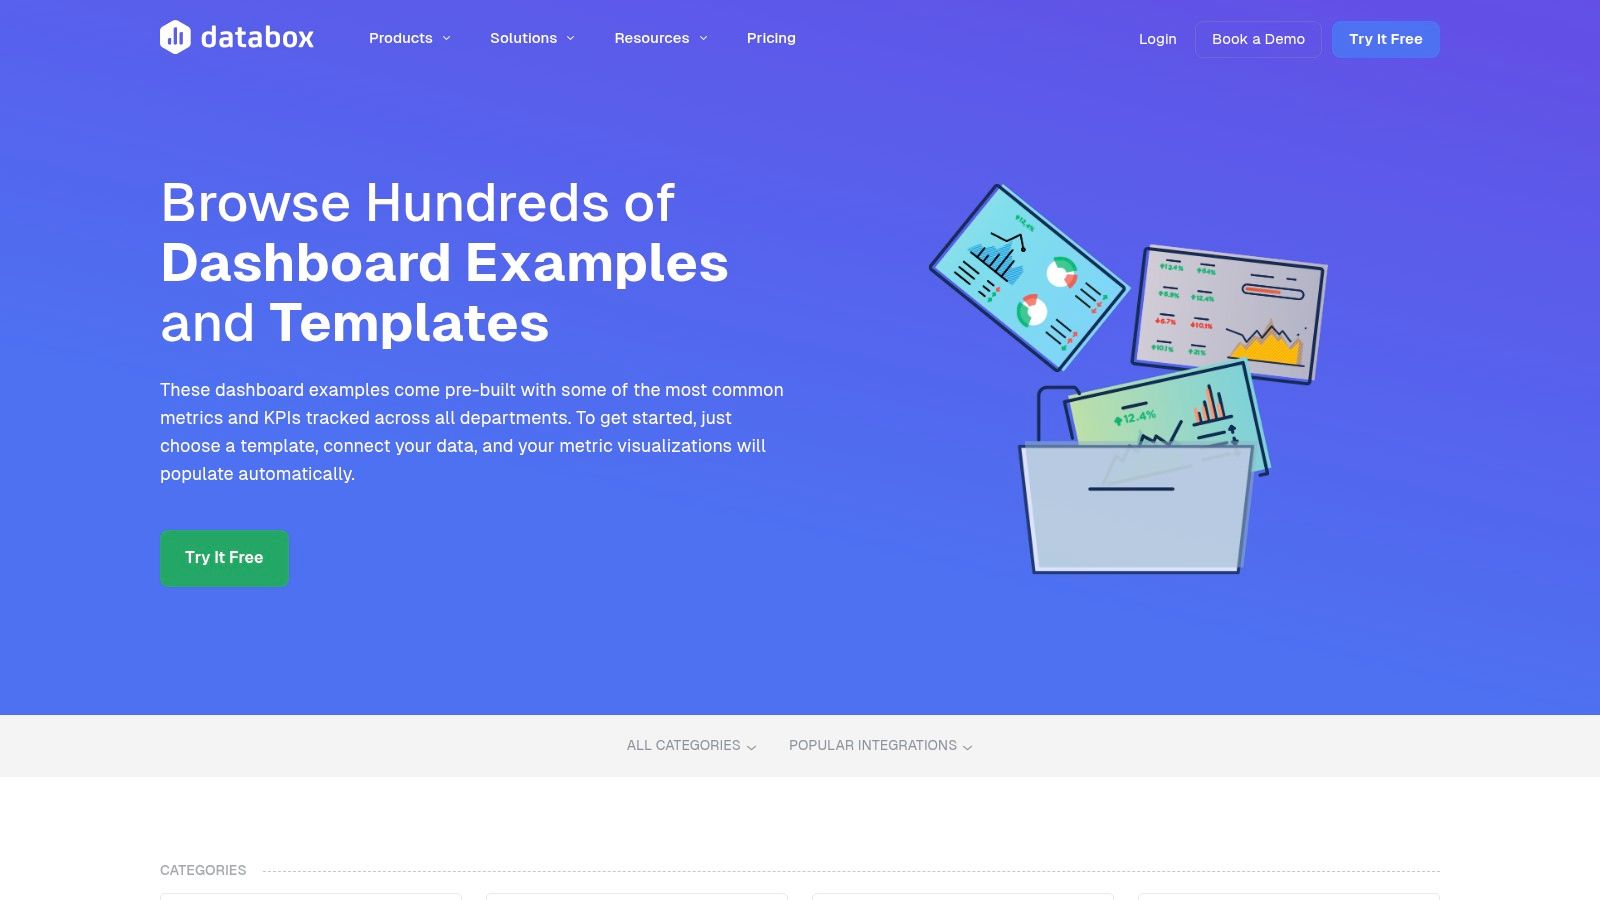
Why It's a Top Choice
The key advantage is speed. With over 130 one-click integrations, you can have a professional, automated report running in minutes. It's great for marketing agencies or sales teams tracking KPIs. While it excels at live dashboards, it's less suited for traditional, narrative-heavy reports. It’s all about the numbers here.
Key Features & User Experience
- Live Data Dashboards: Connect your tools and get real-time updates without manual data entry.
- 300+ Pre-built Templates: Extensive library covering marketing, sales, finance, and e-commerce.
- One-Click Integrations: Easily sync data from popular platforms like GA4 and social media.
- Rapid Setup: Clone a pre-built dashboard, connect your sources, and you’re ready to share.
This is ideal for automating recurring KPI reporting and is a key component in building an effective business dashboard.
Link: Databox Dashboard Examples
10. DashThis (Reporting Templates + Pricing)
For marketing agencies who need to create beautiful, automated client reports without the hassle, DashThis is a major contender. It’s less about creating a static document and more about building live, shareable dashboards. Their platform is packed with preset management report templates for nearly every marketing channel, from SEO to social media.
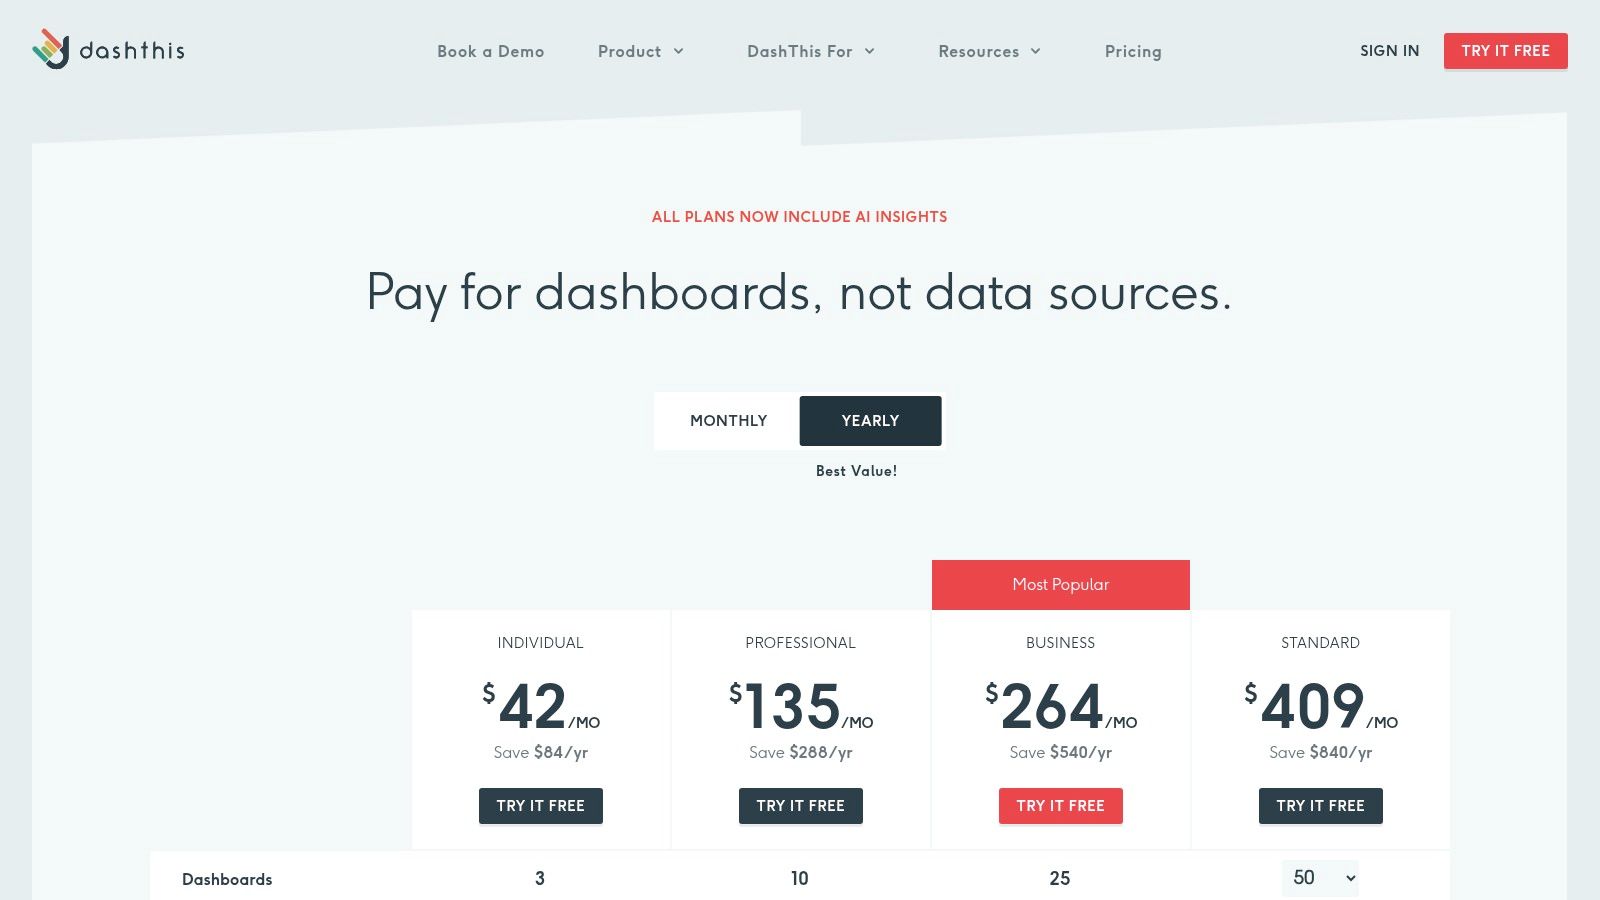
Why It's a Top Choice
DashThis excels at simplicity. You connect your data sources with a few clicks, choose a template, and your dashboard is born. The white-labeling features are a dream for agencies, allowing them to add their own branding. The user experience is clean and designed for marketers, not data scientists. A paid plan is required after the free trial, with pricing based on the number of dashboards.
Key Features & User Experience
- Pre-Built Marketing Templates: Dozens of ready-to-go templates for specific marketing channels.
- Unlimited Integrations: All plans include unlimited integrations, so you aren't penalized for connecting all your data.
- Agency-Focused Features: Robust white-labeling and easy sharing options make client reporting a breeze.
- Automated Delivery: Set up reports to be sent out automatically, highlighting the key benefits of report automation.
This is ideal for teams who prioritize automated, visually appealing marketing dashboards over traditional reports.
Link: DashThis Pricing
11. Klipfolio (Pre‑built Dashboard Templates)
For managers who need live, data-rich dashboards instead of static documents, Klipfolio is a powerhouse. It’s a business dashboard platform with a gallery of pre-built dashboard templates for services like Google Analytics 4 and Salesforce. This approach speeds up reporting by letting you connect your data directly to a professional layout, turning raw data into insights almost instantly.
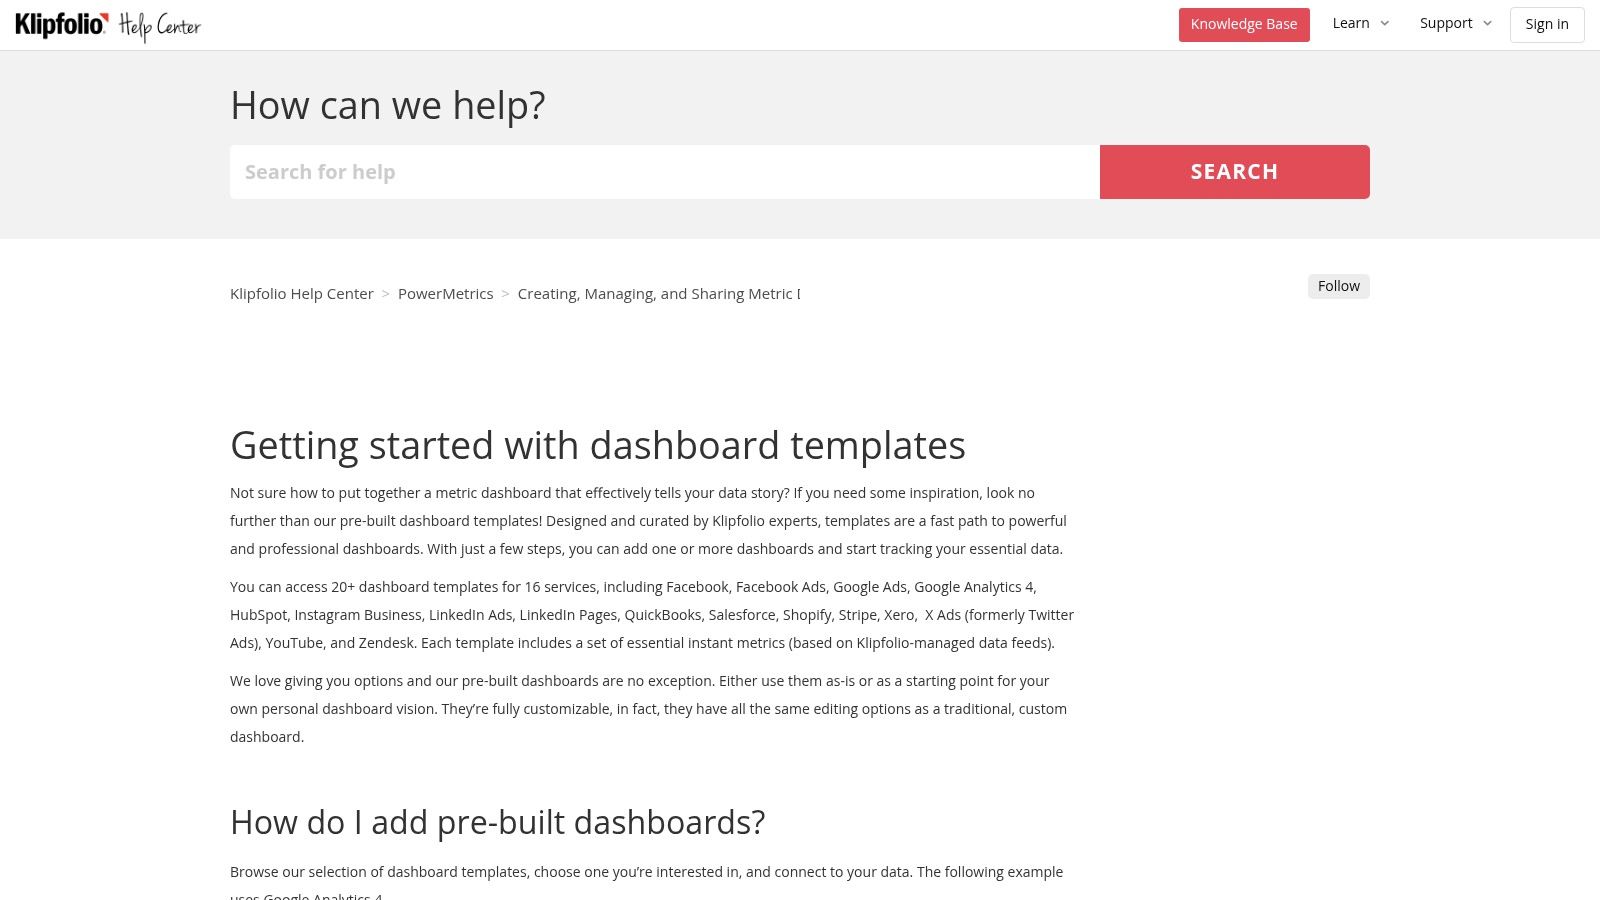
Why It's a Top Choice
Klipfolio’s strength is its speed and integration depth. You choose a template, authorize access to your platform, and the dashboard populates automatically. This is ideal for creating multi-source KPI dashboards. While it’s a paid tool with a bit of a learning curve, its ability to quickly generate data-driven reports is a massive time-saver.
Key Features & User Experience
- Pre-built Templates: A large gallery of ready-to-use dashboards for popular platforms.
- Direct Data Integration: Connectors allow you to pull live data directly from your core business systems.
- Flexible Sharing: Export dashboards as PDFs or share live links for real-time monitoring.
- High Customization: Start with a template and then fine-tune it to your needs.
This is best for teams that prioritize live data and need to combine metrics from multiple sources into a single view.
Link: Klipfolio Dashboard Templates
12. Template.net (Business Report Templates by Document Type)
Template.net is a massive repository for just about any document you can imagine, and its management report templates are no exception. This platform shines when you need a specific report format, like a monthly sales summary, and you want it in a familiar format like Word or Google Docs. It’s less about slick data visualization and more about getting a structured document ready for content.
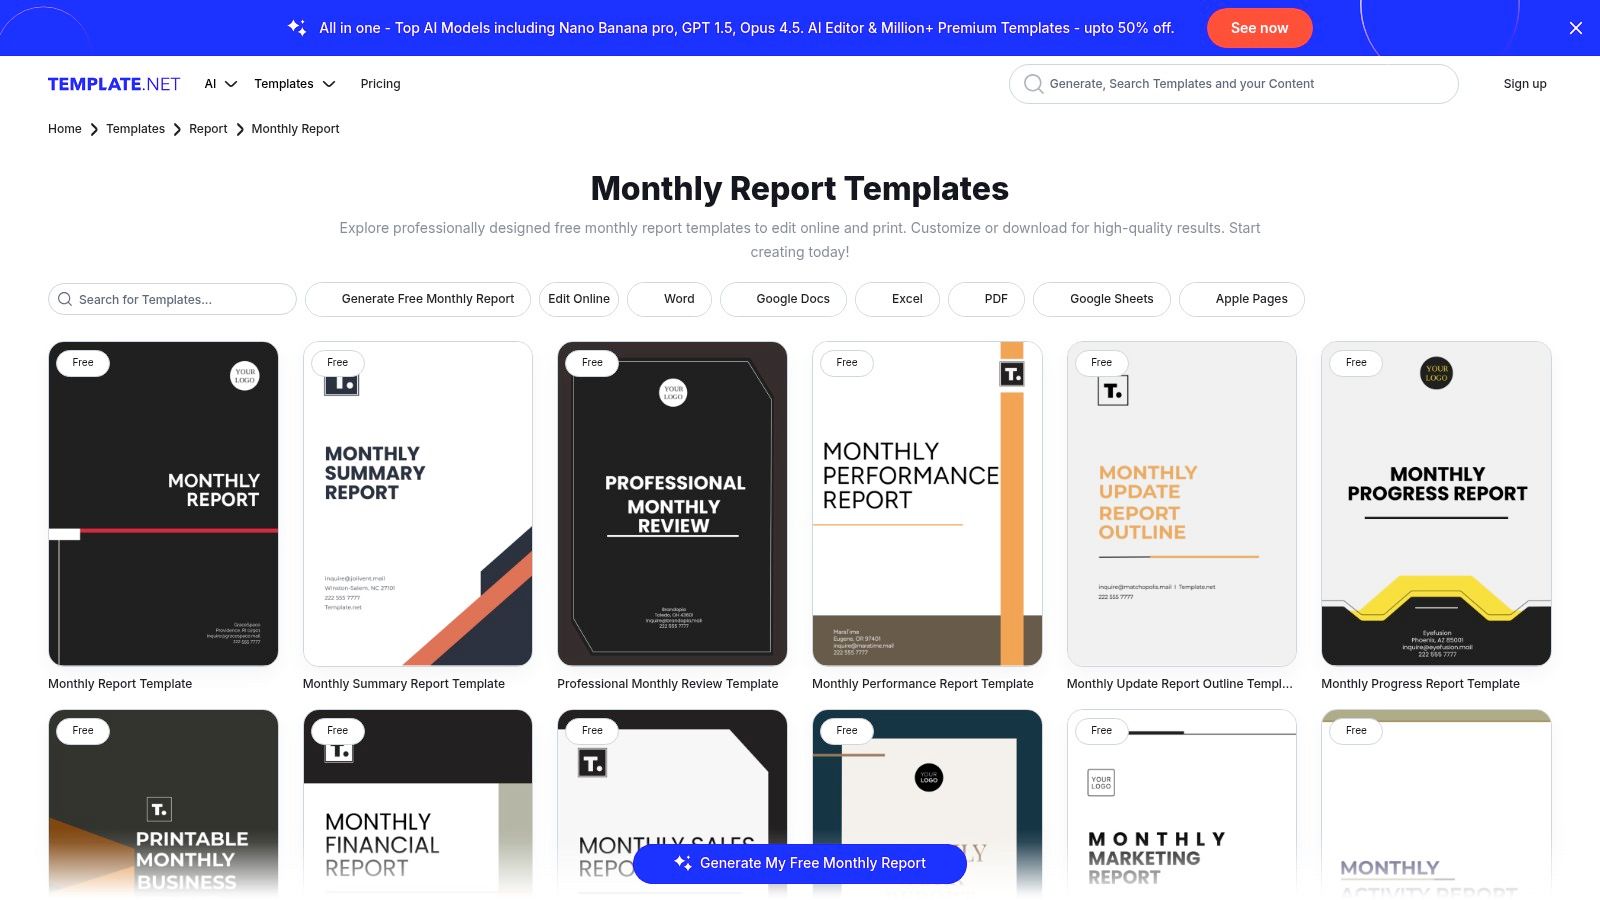
Why It's a Top Choice
The sheer volume is Template.net's main draw. If you need a "monthly construction project report," they probably have it. The platform offers a mix of free and premium content, but the free options are often good enough. However, some users have mentioned issues with subscription billing, so it's smart to read the terms carefully before committing to a paid plan.
Key Features & User Experience
- Extensive Library: A huge collection of templates organized by business function.
- Multiple File Formats: Download templates for Word, Google Docs, Excel, PDF, and more.
- Web Editor: An online editor allows for quick customizations before you download.
- Freemium Access: Many templates are free, with a paid subscription unlocking the full library.
This is ideal for managers who need a standard report layout quickly and prefer working in traditional document editors.
Link: Template.net Business Reports
Top 12 Management Report Template Comparison
| Product | Core features | UX / Quality | Pricing / Value | Best for | Unique selling point |
|---|---|---|---|---|---|
| MetricsWatch (Recommended) | Automated white‑label Reports + real‑time Alerts (multi‑source email templates, anomaly detection) | Fast setup, email & Slack notifications, claims 10‑min detection & zero false positives | Reports from $49/mo (2 reports); Alerts from $99/mo (3 alerts); free trial (no CC) | Agencies, in‑house marketing/analytics, e‑commerce, SaaS product teams, freelancers | Combines automated client reporting and rapid anomaly/site‑issue detection in one platform |
| Microsoft Create (Office templates) | Word/Excel/PowerPoint report templates with enterprise formatting | Native MS 365 experience; brand‑safe typography | Free templates; some premium require MS365 subscription | Enterprise teams and stakeholders using Office workflows | Native integration with Microsoft 365 and enterprise document standards |
| Google Looker Studio (Report Gallery) | Ready‑to‑copy dashboards for GA4, Ads, YouTube, BigQuery | Free, data‑connected templates; quick to clone & connect | Free with Google account and connectors | Marketing, product, web analytics teams using Google stack | Direct GA product templates and easy connector setup for automated dashboards |
| Canva Templates | Browser editor, brand kits, collaboration, export to PDF/PPTX/PNG | Fast customization; visually polished outputs for non‑designers | Freemium; Pro/Teams paid plans for premium assets | Marketers, designers, client‑facing report creators | Huge designer library + easy brand application and collaboration |
| Adobe Express Templates | Drag‑and‑drop report templates, charts, brand elements | Modern visual design in browser; good for shareable PDFs | Freemium; paid Adobe Express features/assets | Visual report designers and marketing teams | Adobe‑quality visual templates with quick browser editing |
| Smartsheet (Downloadable templates) | Executive, weekly/monthly status, dashboards; multiple formats | Practical business layouts with RAG/KPIs; native Smartsheet options | Templates free to download; Smartsheet platform paid | Project managers, PMOs, operations & execs | Business‑focused status and portfolio templates with Smartsheet integration |
| Envato Elements | InDesign/PowerPoint/Word professional report kits; print‑ready files | High‑quality typeset templates for long‑form reports | Subscription (unlimited downloads while subscribed) | Agencies and designers creating multi‑page/annual reports | Professionally typeset, print‑ready report systems and master styles |
| Creative Market | Pay‑per‑item report templates across formats and styles | Wide aesthetic variety; quality varies by seller | One‑time purchase per item | Single projects, bespoke visual styles, designers | Buy once, use under seller license — ideal for unique, pay‑per‑item needs |
| Databox (Dashboard templates) | 300+ prebuilt dashboards, 130+ integrations, KPI categories | Live automated dashboards; rapid time‑to‑insight | Free tier; paid plans for advanced features/scale | Agencies, marketers, data teams needing recurring KPI dashboards | Large template library + many one‑click integrations for KPI reporting |
| DashThis | Preset marketing templates, white‑label reports, exports | Simple UX geared to agencies; quick setup | 14‑day free trial; pricing scales by dashboards | Agencies and marketing teams delivering client reports | Agency‑focused automated reporting with white‑label export options |
| Klipfolio | Pre‑built dashboard gallery, flexible customization, exports | Flexible customization; moderate learning curve for advanced builds | Paid plans (tiered by features/users) | Analysts and teams building custom KPI dashboards | Highly customizable dashboards with broad integrations |
| Template.net | Extensive library by report type; multiple downloadable formats | Quick downloads and web editor; covers many report cadences | Free items + paid membership options | Teams needing standard office templates across functions | Huge selection organized by document/report type and format |
From Tedious Task to Strategic Tool
Well, you made it. We’ve journeyed through a universe of management report templates, from trusty spreadsheets to dynamic dashboards. The biggest takeaway? You should never have to stare at a blank page again.
The goal isn't just to make reports; it's to create a system that drives better decisions. According to research from Tableau, a whopping 87% of business leaders believe better use of data would improve their decision-making. By starting with a solid template, you skip the grunt work and jump straight to the good part: analysis and insight.
Key Takeaways for Your Reporting Revolution
Let's boil this down to a few core ideas.
- Define Your "Why" First: Before you download anything, ask yourself: Who is this for, and what do I want them to do after reading it? An executive summary for the C-suite is totally different from a weekly KPI dashboard for your team.
- Automation is Your Best Friend: Manually pulling data is a recipe for mistakes and burnout. Tools like MetricsWatch and DashThis exist to connect to your data sources and do the heavy lifting for you. This frees you up for actual thinking.
- Static vs. Dynamic: A downloadable Word template is perfect for a one-off quarterly review. But for ongoing performance tracking, an interactive dashboard from a platform like Looker Studio or Databox is way more effective.
- Design for Skimming: Your report is competing for attention. Use clear headings, charts, and call-outs to guide the reader's eye. The best report communicates its key message in under 60 seconds.
Choosing Your Weapon: A Quick Guide
Feeling overwhelmed? Here’s a simple way to decide:
- If you need a quick, free, and familiar format: Start with Microsoft Create or the Google Looker Studio Report Gallery. They’re accessible and perfect for internal teams already in those ecosystems.
- If you prioritize beautiful design and branding: Canva and Adobe Express are your go-tos. They make it easy to create stunning reports that align with your brand, which is crucial for client-facing documents. The power of templates also extends beyond internal reporting; for example, you can learn about designing effective PDF templates for lead capture.
- If you need full automation and hands-off delivery: This is where a dedicated reporting tool shines. MetricsWatch is built for "set it and forget it" delivery, while Databox and Klipfolio offer more complex, real-time dashboards.
Ultimately, the best management report templates are the ones that get used. They turn a confusing mess of numbers into a clear story that guides your team. Stop building reports from scratch. Pick a template, connect your data, and turn your reporting process into your most powerful strategic tool.
Ready to put your reporting on autopilot? MetricsWatch pulls data from your favorite tools like Google Analytics and Facebook Ads and delivers clean, automated reports directly to your inbox. Stop chasing data and start making decisions by trying MetricsWatch today.


